

Question: 1. Include a screenshot image below of your simulation from the M&M simulator. 2. Complete this table with your findings (Round decimals to the
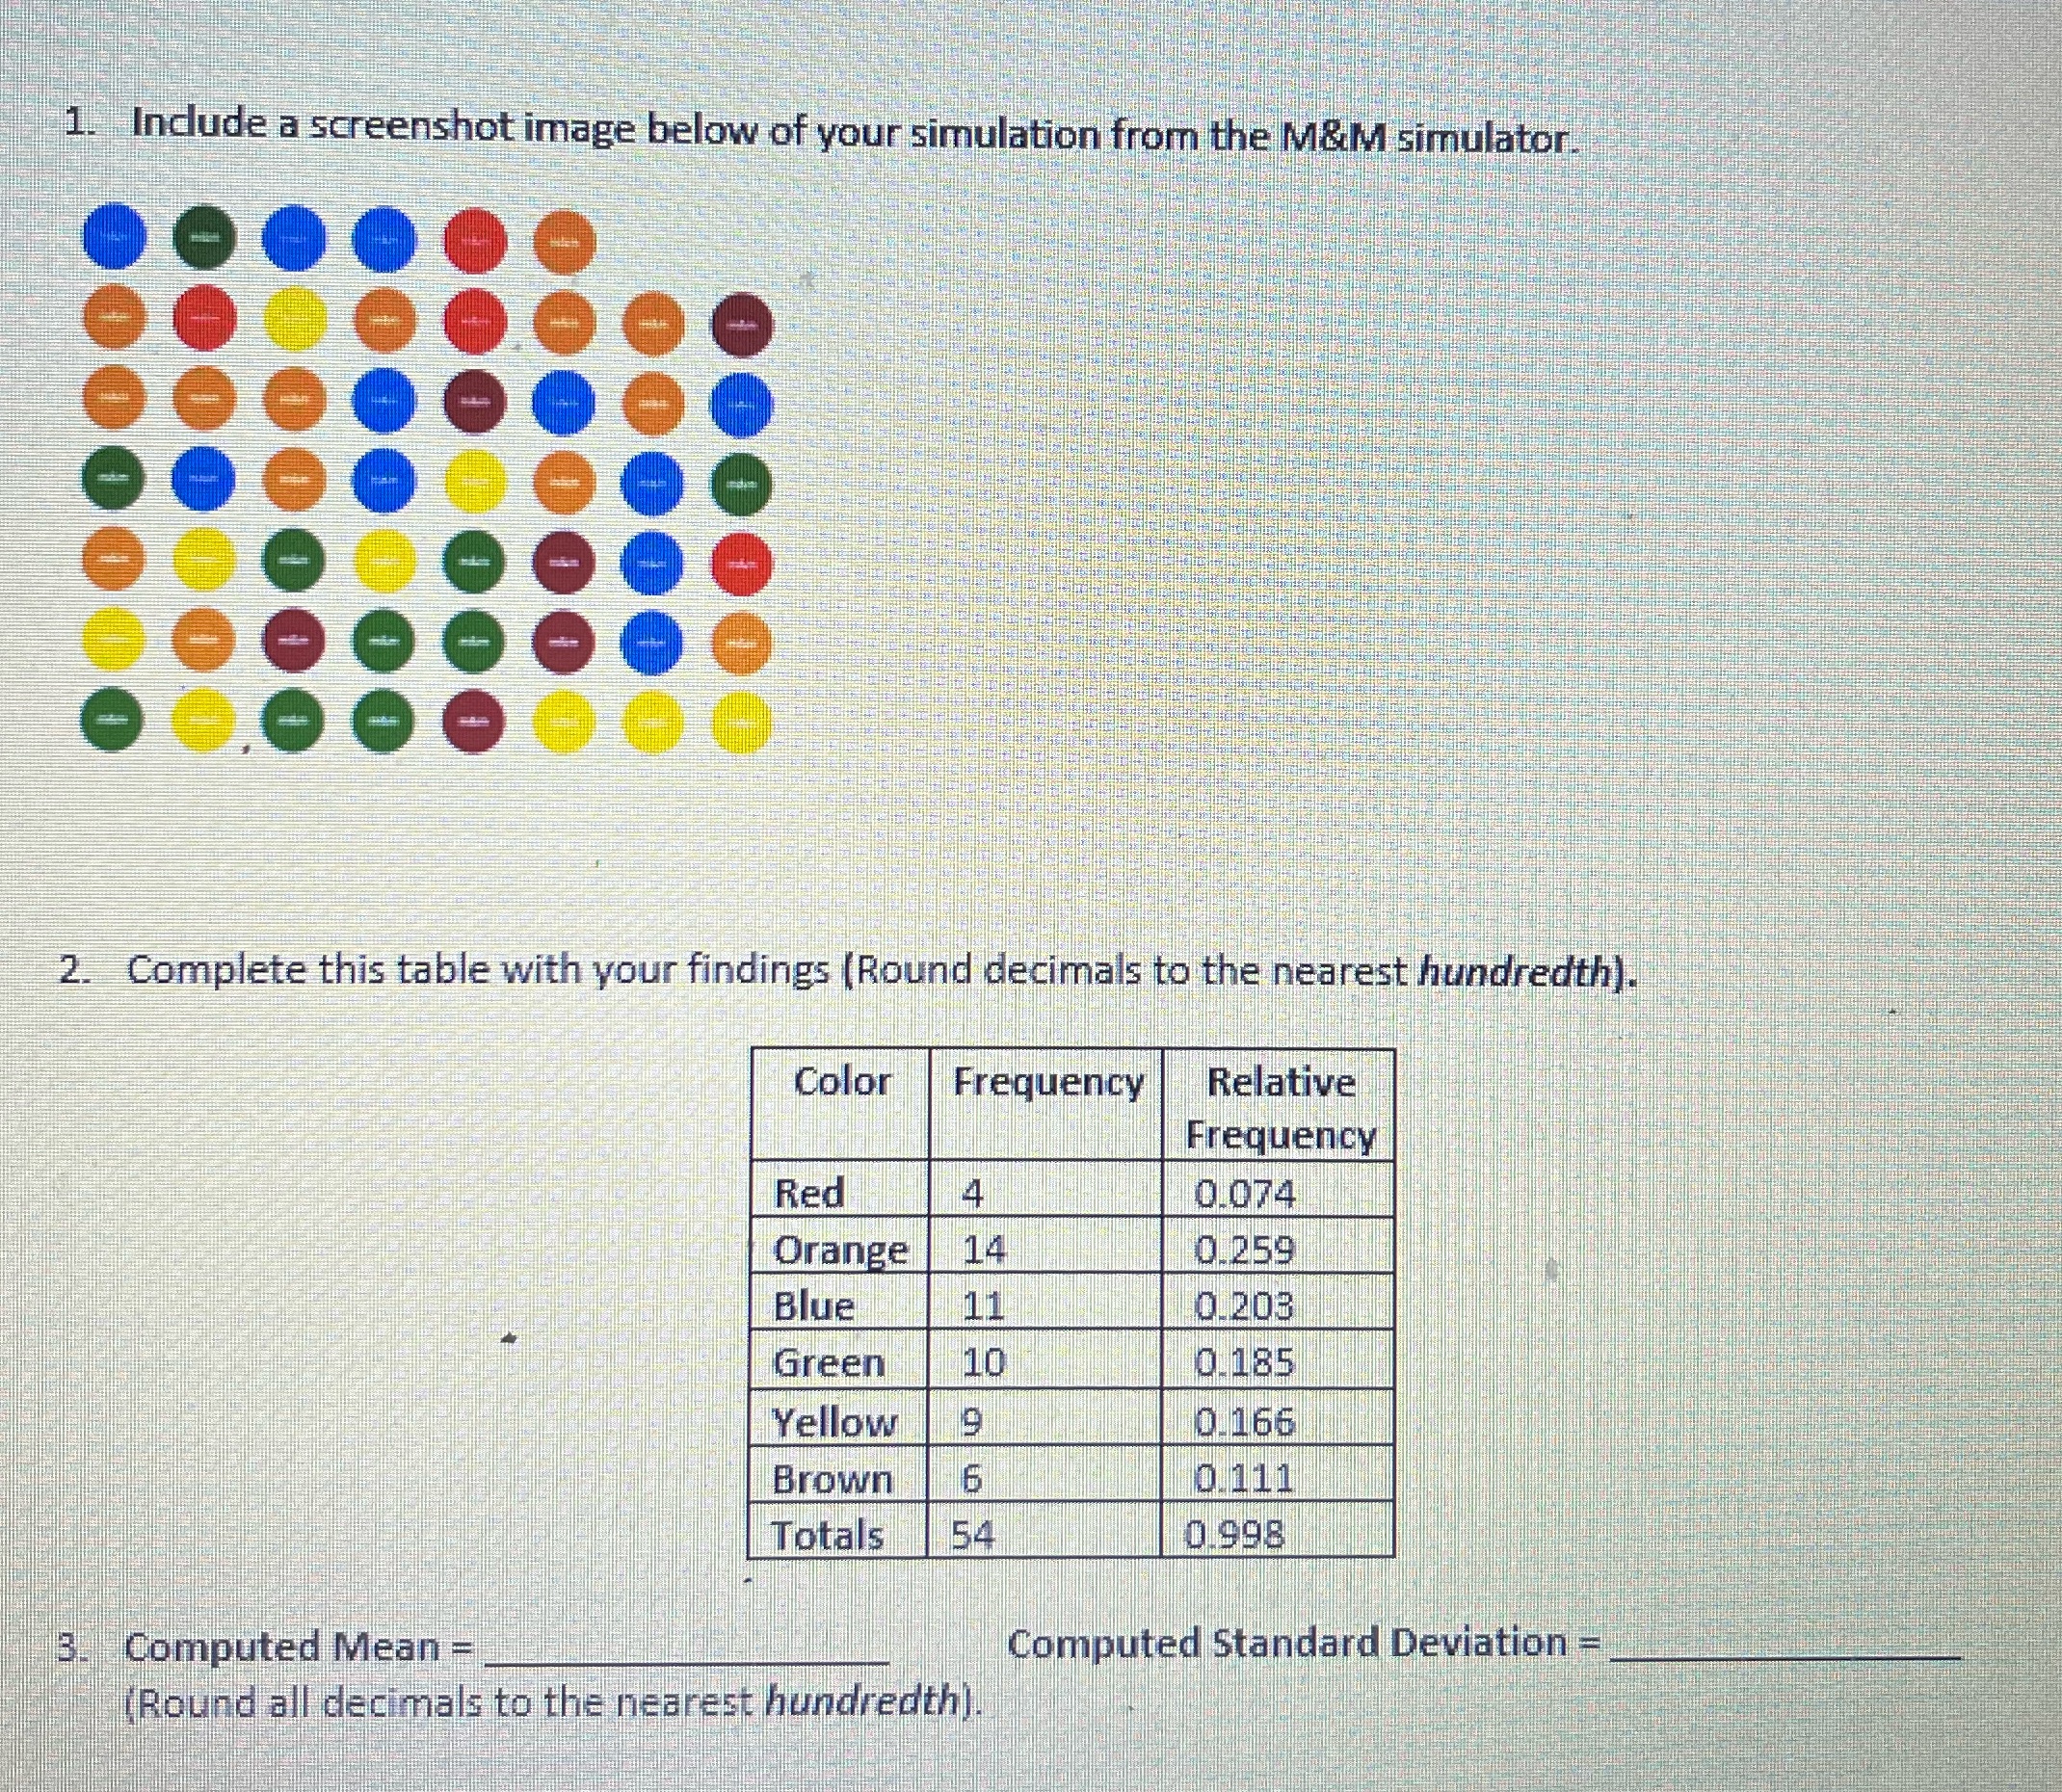
1. Include a screenshot image below of your simulation from the M&M simulator. 2. Complete this table with your findings (Round decimals to the nearest hundredth). Color Frequency Relative Frequency Red 4 0.074 Orange 14 0.259 Blue 11 0.203 Green 10 0.185 Yellow 9 0.166 Brown 6 0.111 Totals 54 0.998 3. Computed Mean = Computed Standard Deviation = (Round all decimals to the nearest hundredth).
Step by Step Solution
There are 3 Steps involved in it
1 Expert Approved Answer
Step: 1 Unlock

Question Has Been Solved by an Expert!
Get step-by-step solutions from verified subject matter experts
Step: 2 Unlock
Step: 3 Unlock