

Question: 1. Include a screenshot image below of your simulation from the |V|&M simulator. 2. Complete this table with your findings (Round decimals to the nearest
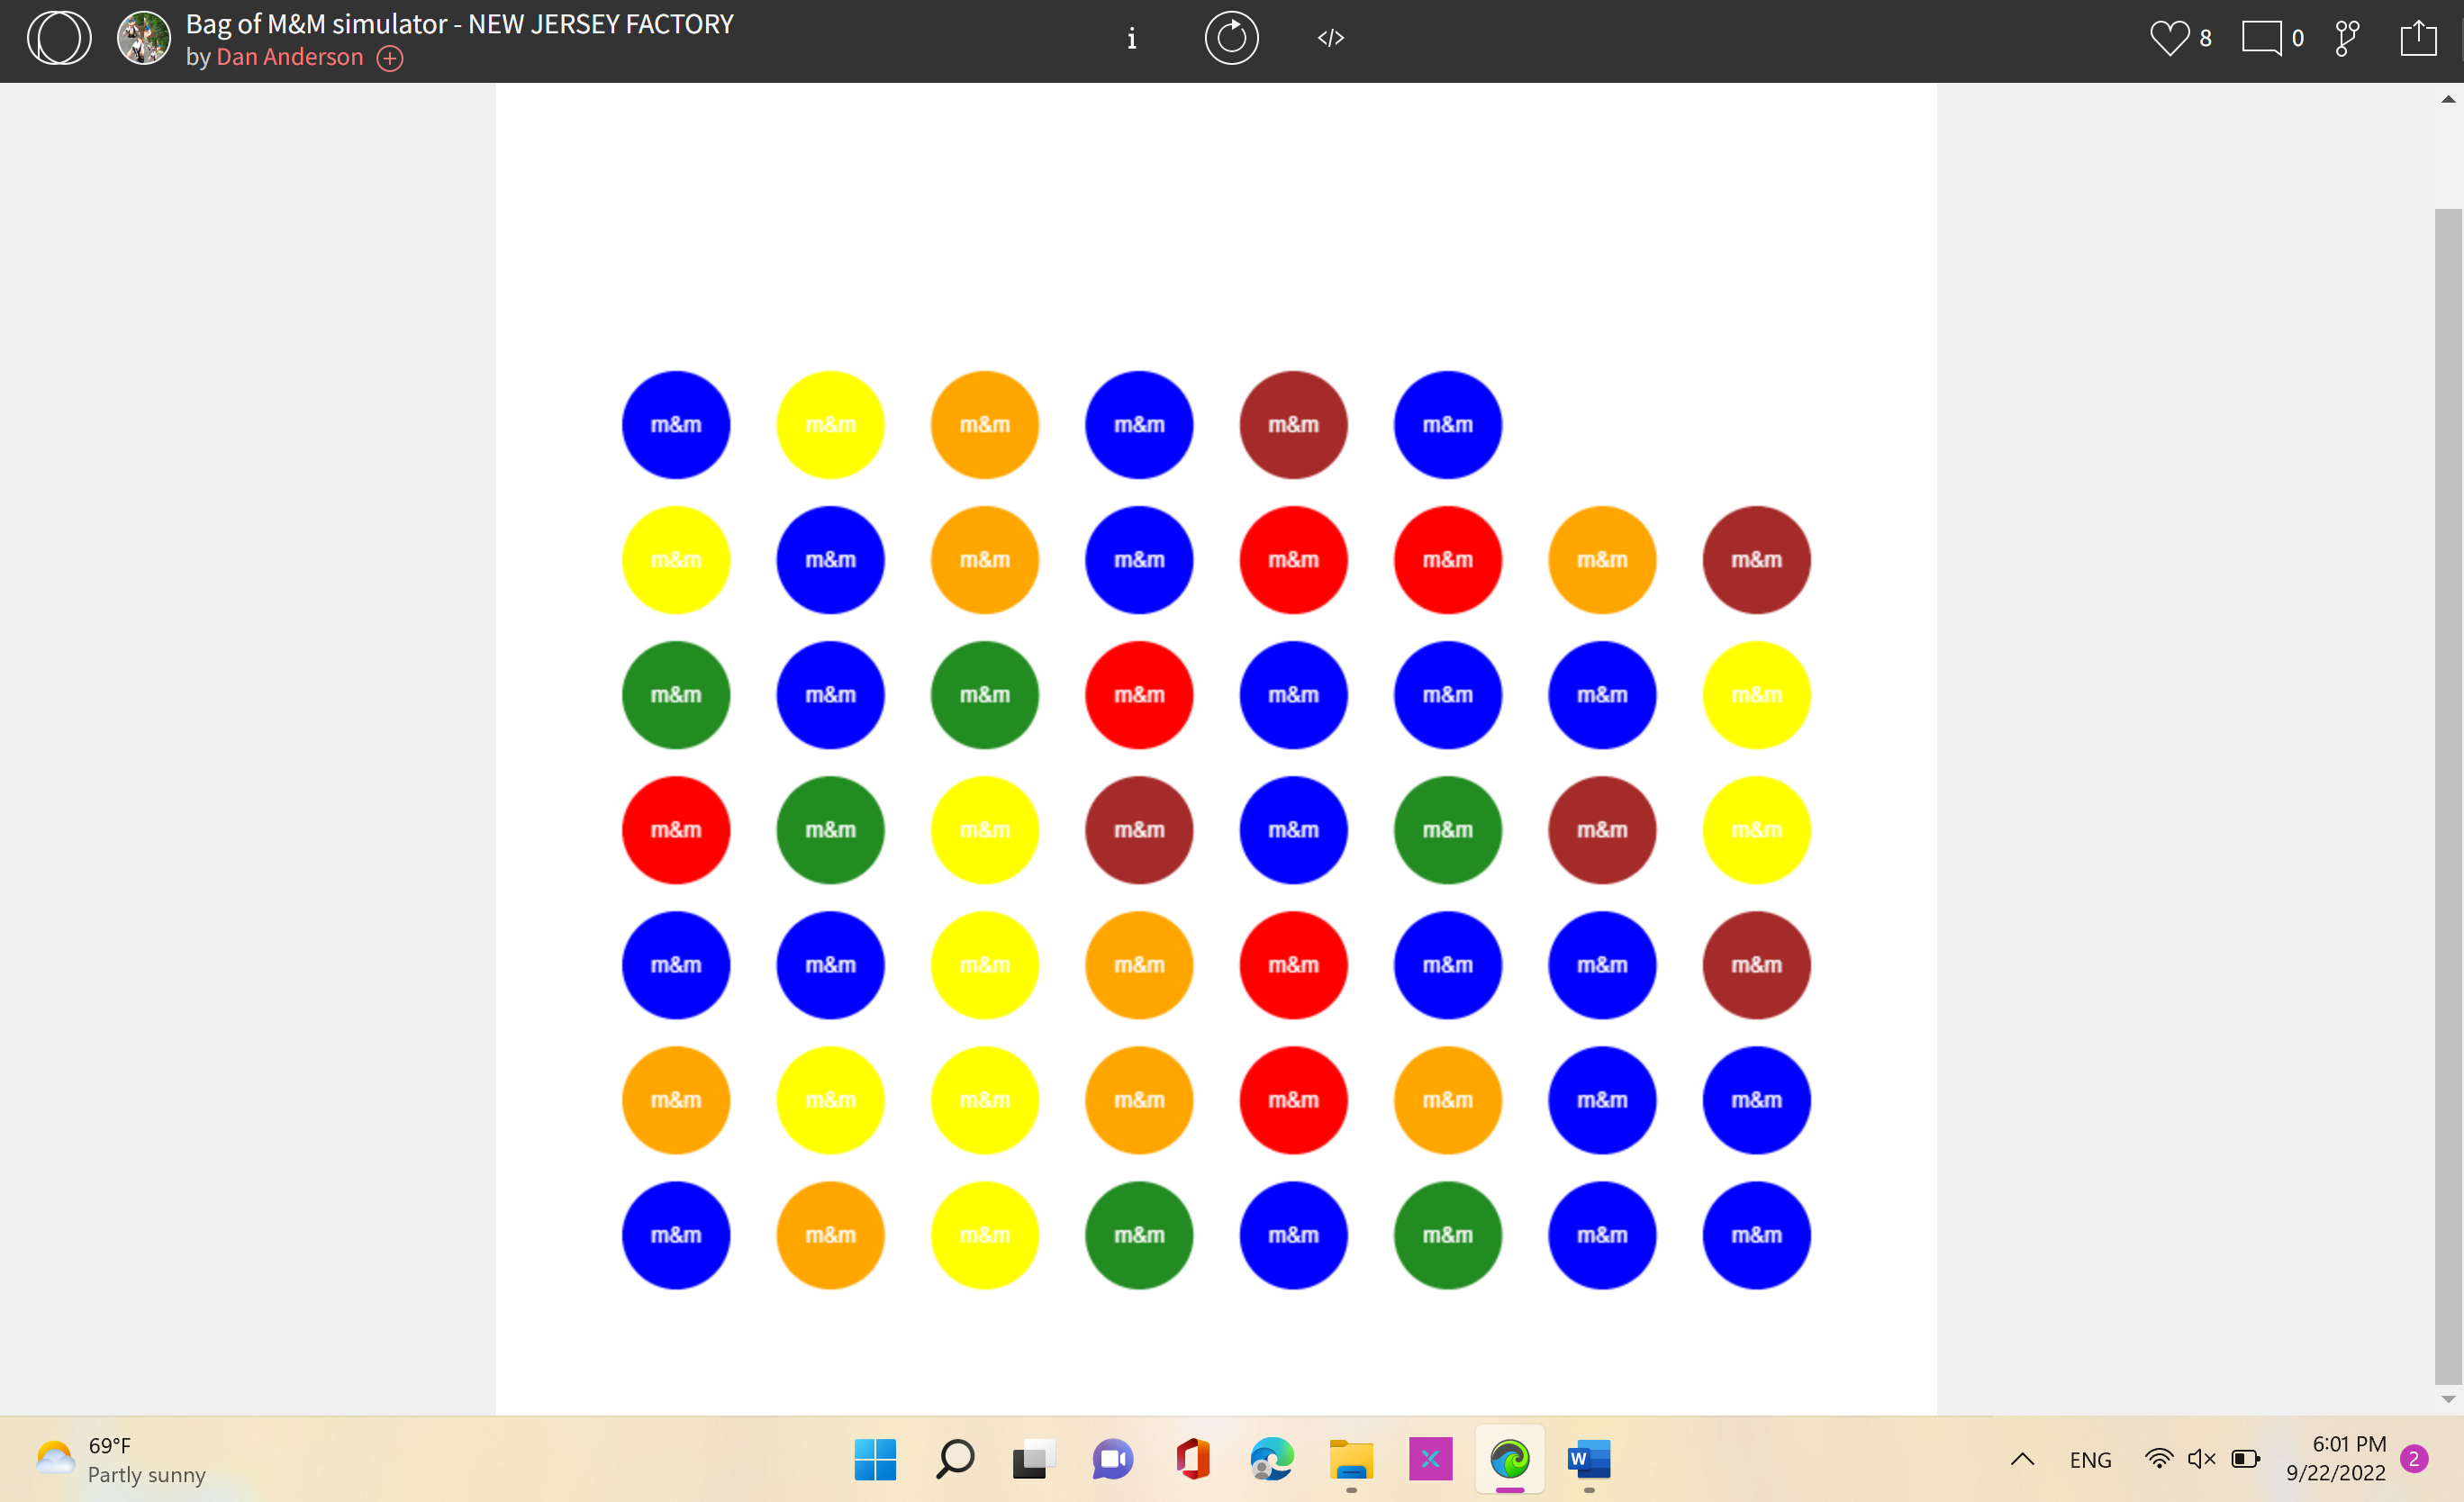
1. Include a screenshot image below of your simulation from the |V|&M simulator. 2. Complete this table with your findings (Round decimals to the nearest tenth). Color Frequency Relative Frequency 3. Computed Mean = Computed Standard Deviation = (Round all decimals to the nearest tenth). 4. Add screenshot of this entire document to the discussion board as part of your discussion prompt (do NOT upload the MS Word document). O Bag of M&M simulator - NEW JERSEY FACTORY N. by Dan Anderson + > m&m 69.F Partly sunny X W ENG 6:01 PM 9/22/2022
Step by Step Solution
There are 3 Steps involved in it
1 Expert Approved Answer
Step: 1 Unlock

Question Has Been Solved by an Expert!
Get step-by-step solutions from verified subject matter experts
Step: 2 Unlock
Step: 3 Unlock