

Question: 1. Indicate the approximate dates on which the short-term moving average (20-day) crosses the long-term moving average (200-day) from above (sell signal) and below (buy
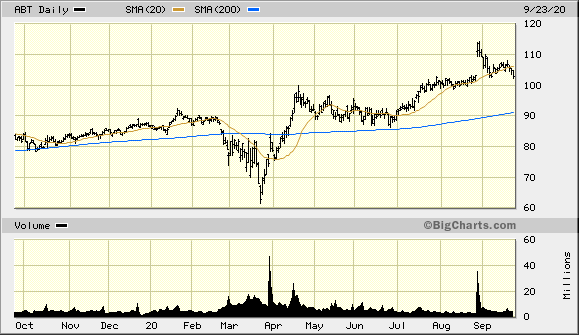
1. Indicate the approximate dates on which the short-term moving average (20-day) crosses the long-term moving average (200-day) from above (sell signal) and below (buy signal). Indicate the type of signal generated, buy or sell, on each date.
2. The moving-average oscillator generated one round-trip trade over this period. Would either of them have yielded positive returns? Why or why not? Be careful here. The intersection of the long and short moving averages is the signal, not the transaction price.
3. In general, why might the moving average indicator work, i.e., what information might this indicator be picking up that fundamental analysis misses?
4. In general, why might the moving average indicator, or any technical indicator for that matter, not work?
ABT Daily SMA (20) SMA (200) 9/23/20 120 110 100 90 mimme 80 70 60 Volume BigCharts.com 60 40 Millions 20 Oct Nov Dec 20 Feb Mar Apr May Jun Jul Aug Sep
Step by Step Solution
There are 3 Steps involved in it

Get step-by-step solutions from verified subject matter experts