

Question: Old MathJax webview I need you to answer the question below. I am attaching the updated chart with the date 11/12/21 below. Use the chart
Old MathJax webview
I need you to answer the question below. I am attaching the updated chart with the date 11/12/21 below. Use the chart to answer the parts. It is a very simple question.
a. Indicate the approximate dates on which the short-term moving average (20-day) crosses the long-term moving average (200-day) from above (sell signals) and below (buy signals).
b. Suppose you were to only transact using the moving average signals. In general, would any round-trip transactions[1] that traded on these signals have yielded positive returns over this period? Why or why not? Suggest another technical trading signal that might better fit this chart.
c. Why might the moving average oscillator work? Put differently, what information about market psychology or behavior might the MA oscillator be picking up?
d. Fundamentally, why might the moving average indicator not work? Put differently, what information about market psychology or behavior might the MA oscillator be picking up
Below is the updated chart. You do not need to search for the chart as said in the question
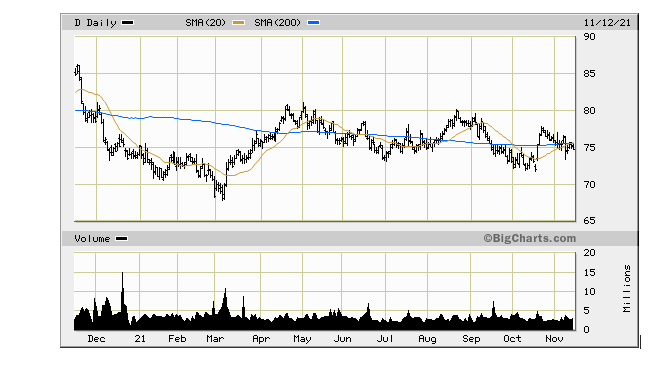
You only need to answer the four parts given seeing the 2nd chart with date 11/12/21.
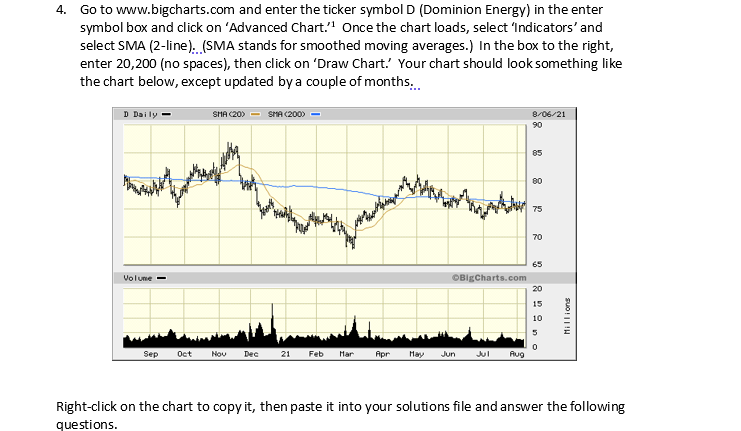
4. Go to www.bigcharts.com and enter the ticker symbol D (Dominion Energy) in the enter symbol box and click on 'Advanced Chart. Once the chart loads, select 'Indicators' and select SMA (2-line). (SMA stands for smoothed moving averages.) In the box to the right, enter 20,200 (no spaces), then click on 'Draw Chart.' Your chart should look something like the chart below, except updated by a couple of months... D Daily - SHA (20) SMA (200) - 8/06/21 90 85 20 word handatur 75 70 Volune 65 BigCharts.com 20 15 10 5 Millions 0 Sep Oct Nov Dec 21 Feb Har Apr May Jun Aug Right-click on the chart to copy it, then paste it into your solutions file and answer the following questions. D Daily SMA (20) SMA (200) 11/12/21 90 85 80 Ewy 75 70 Volume 65 BigCharts.com 20 15 10 Millions 5 0 Dec 21 Feb Mar Apr May Jun Aug Sep Oct Nov 4. Go to www.bigcharts.com and enter the ticker symbol D (Dominion Energy) in the enter symbol box and click on 'Advanced Chart. Once the chart loads, select 'Indicators' and select SMA (2-line). (SMA stands for smoothed moving averages.) In the box to the right, enter 20,200 (no spaces), then click on 'Draw Chart.' Your chart should look something like the chart below, except updated by a couple of months... D Daily - SHA (20) SMA (200) - 8/06/21 90 85 20 word handatur 75 70 Volune 65 BigCharts.com 20 15 10 5 Millions 0 Sep Oct Nov Dec 21 Feb Har Apr May Jun Aug Right-click on the chart to copy it, then paste it into your solutions file and answer the following questions. D Daily SMA (20) SMA (200) 11/12/21 90 85 80 Ewy 75 70 Volume 65 BigCharts.com 20 15 10 Millions 5 0 Dec 21 Feb Mar Apr May Jun Aug Sep Oct Nov
Step by Step Solution
There are 3 Steps involved in it

Get step-by-step solutions from verified subject matter experts