

Question: 1. Load Data (Which includes separating the data into X and y ) 2. Do some initial visualizations (e.g., scatter plots or visualizations with 2
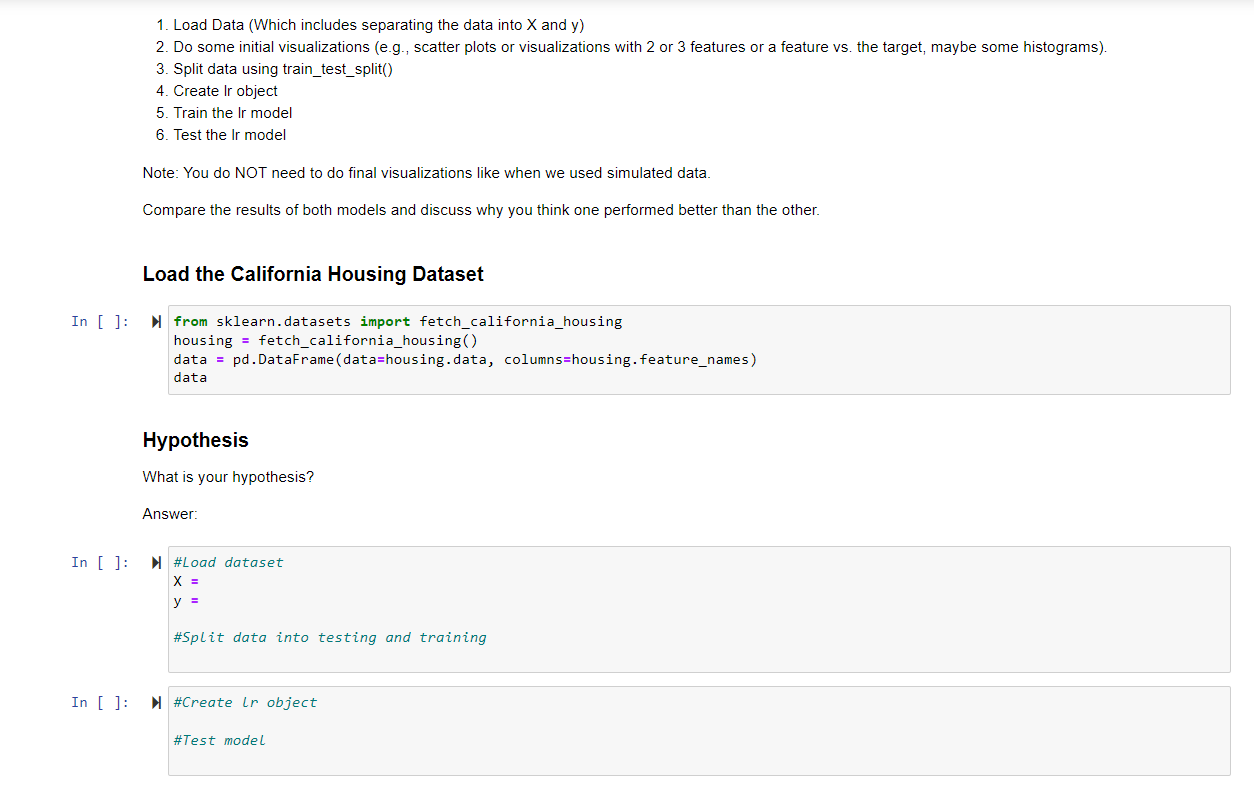
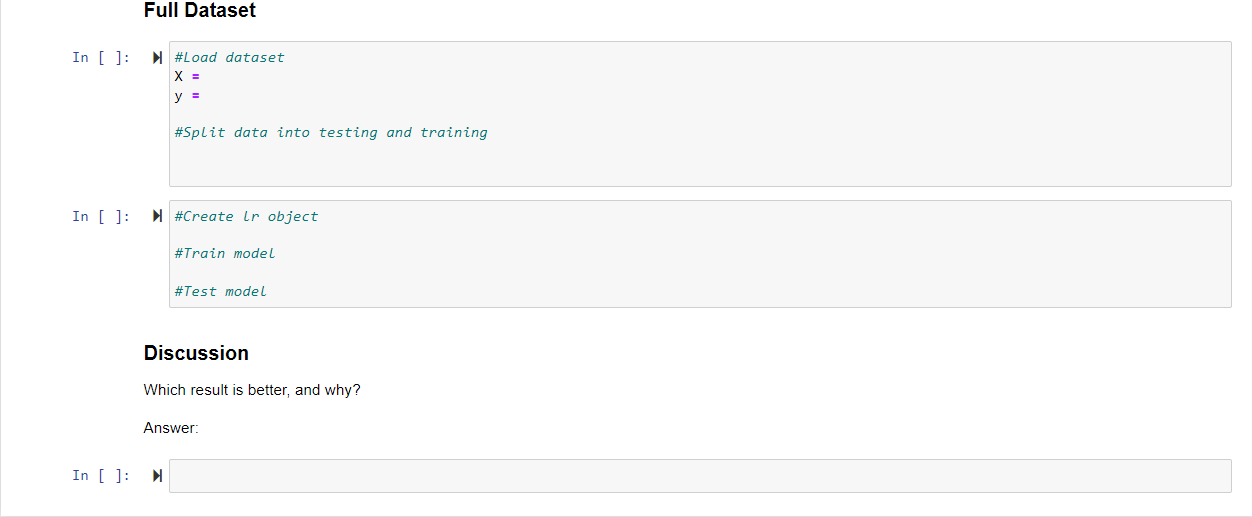
1. Load Data (Which includes separating the data into X and y ) 2. Do some initial visualizations (e.g., scatter plots or visualizations with 2 or 3 features or a feature vs. the target, maybe some histograms). 3. Split data using train_test_split() 4. Create Ir object 5. Train the Ir model 6. Test the Ir model Note: You do NOT need to do final visualizations like when we used simulated data. Compare the results of both models and discuss why you think one performed better than the other. Full Dataset In [ ] : \#Load dataset x= y= \#Split data into testing and training Discussion Which result is better, and why? Answer: In [ ]
Step by Step Solution
There are 3 Steps involved in it

Get step-by-step solutions from verified subject matter experts