

Question: 1. Make a financial analysis out of the data given below. 2. Make a conclusion based on your financial analysis. Year One Year Two Liquidity
1. Make a financial analysis out of the data given below.
2. Make a conclusion based on your financial analysis.
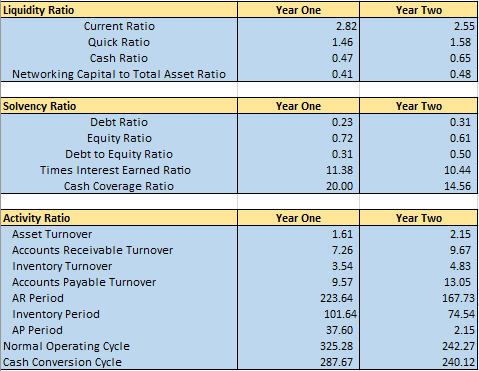
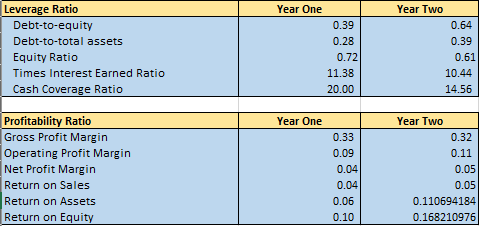
Year One Year Two Liquidity Ratio Current Ratio Quick Ratio Cash Ratio Networking Capital to Total Asset Ratio 1.46 0.47 0.41 2.55 1.58 0.65 0.48 Solvency Ratio Debt Ratio Equity Ratio Debt to Equity Ratio Times Interest Earned Ratio Cash Coverage Ratio Year One 0.23 0.72 0.31 11.38 20.00 Year Two 0.31 0.61 0.50 10.44 14.56 Activity Ratio Asset Turnover Accounts Receivable Turnover Inventory Turnover Accounts Payable Turnover AR Period Inventory Period AP Period Normal Operating Cycle Cash Conversion Cycle Year One 1.61 7.26 3.54 9.57 223.64 101.64 37.60 325.28 287.67 Year Two 2.15 9.67 4.83 13.05 167.73 74.54 2.15 242.27 240.12 Leverage Ratio Debt-to-equity Debt-to-total assets Equity Ratio Times Interest Earned Ratio Cash Coverage Ratio Year One 0.39 0.28 0.72 11.38 20.00 Year Two 0.64 0.39 0.61 10.44 14.56 Year One Year Two Profitability Ratio Gross Profit Margin Operating Profit Margin Net Profit Margin Return on Sales Return on Assets Return on Equity 0.33 0.09 0.04 0.04 0.06 0.10 0.32 0.11 0.05 0.05 0.110694184 0.168210976 Year One Year Two Liquidity Ratio Current Ratio Quick Ratio Cash Ratio Networking Capital to Total Asset Ratio 1.46 0.47 0.41 2.55 1.58 0.65 0.48 Solvency Ratio Debt Ratio Equity Ratio Debt to Equity Ratio Times Interest Earned Ratio Cash Coverage Ratio Year One 0.23 0.72 0.31 11.38 20.00 Year Two 0.31 0.61 0.50 10.44 14.56 Activity Ratio Asset Turnover Accounts Receivable Turnover Inventory Turnover Accounts Payable Turnover AR Period Inventory Period AP Period Normal Operating Cycle Cash Conversion Cycle Year One 1.61 7.26 3.54 9.57 223.64 101.64 37.60 325.28 287.67 Year Two 2.15 9.67 4.83 13.05 167.73 74.54 2.15 242.27 240.12 Leverage Ratio Debt-to-equity Debt-to-total assets Equity Ratio Times Interest Earned Ratio Cash Coverage Ratio Year One 0.39 0.28 0.72 11.38 20.00 Year Two 0.64 0.39 0.61 10.44 14.56 Year One Year Two Profitability Ratio Gross Profit Margin Operating Profit Margin Net Profit Margin Return on Sales Return on Assets Return on Equity 0.33 0.09 0.04 0.04 0.06 0.10 0.32 0.11 0.05 0.05 0.110694184 0.168210976
Step by Step Solution
There are 3 Steps involved in it

Get step-by-step solutions from verified subject matter experts