

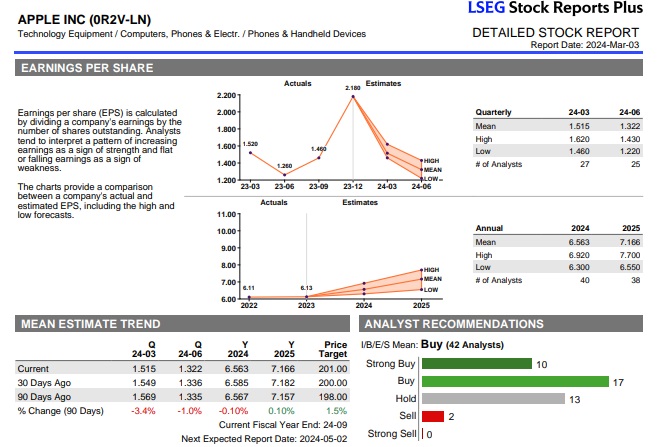
Question: 1 . On March 3 , 2 0 2 4 , the LSEG stock reports plus shows that 4 0 sell - side analysts' forecasts
On March the LSEG stock reports plus shows that sellside analysts' forecasts for Apple's annual EPS forecast in range between $ to $ with a mean EPS forecast of $ How close is your annual EPS forecast to these forecasts? What do you think are the sources of any major differences?
Just need an expainanation for this statement and why this is
My annual EPS forecast of $ is within the sellside analysts forecast price. So there are no major differences
APPLE INC RVLN
EARNINGS PER SHARE
Earnings per share EPS is calculated
by dividing a company's earnings by the
number of shares outstanding. Analysts
tend to interpret a pattem of increasing
earnings as a sign of strength and flat
or falling eamings as a sign of
weakness.
The charts provide a comparison
between a company's actual and
estimated EPS, including the high and
low forecasts.
Step by Step Solution
There are 3 Steps involved in it
1 Expert Approved Answer
Step: 1 Unlock

Question Has Been Solved by an Expert!
Get step-by-step solutions from verified subject matter experts
Step: 2 Unlock
Step: 3 Unlock