

Question: 1. One-Way Analysis of Variance Source df SS MS F P Between Groups 3 197.040 65.680 13.68 0.0001 Within Groups 143 686.811 4.803 Total 146
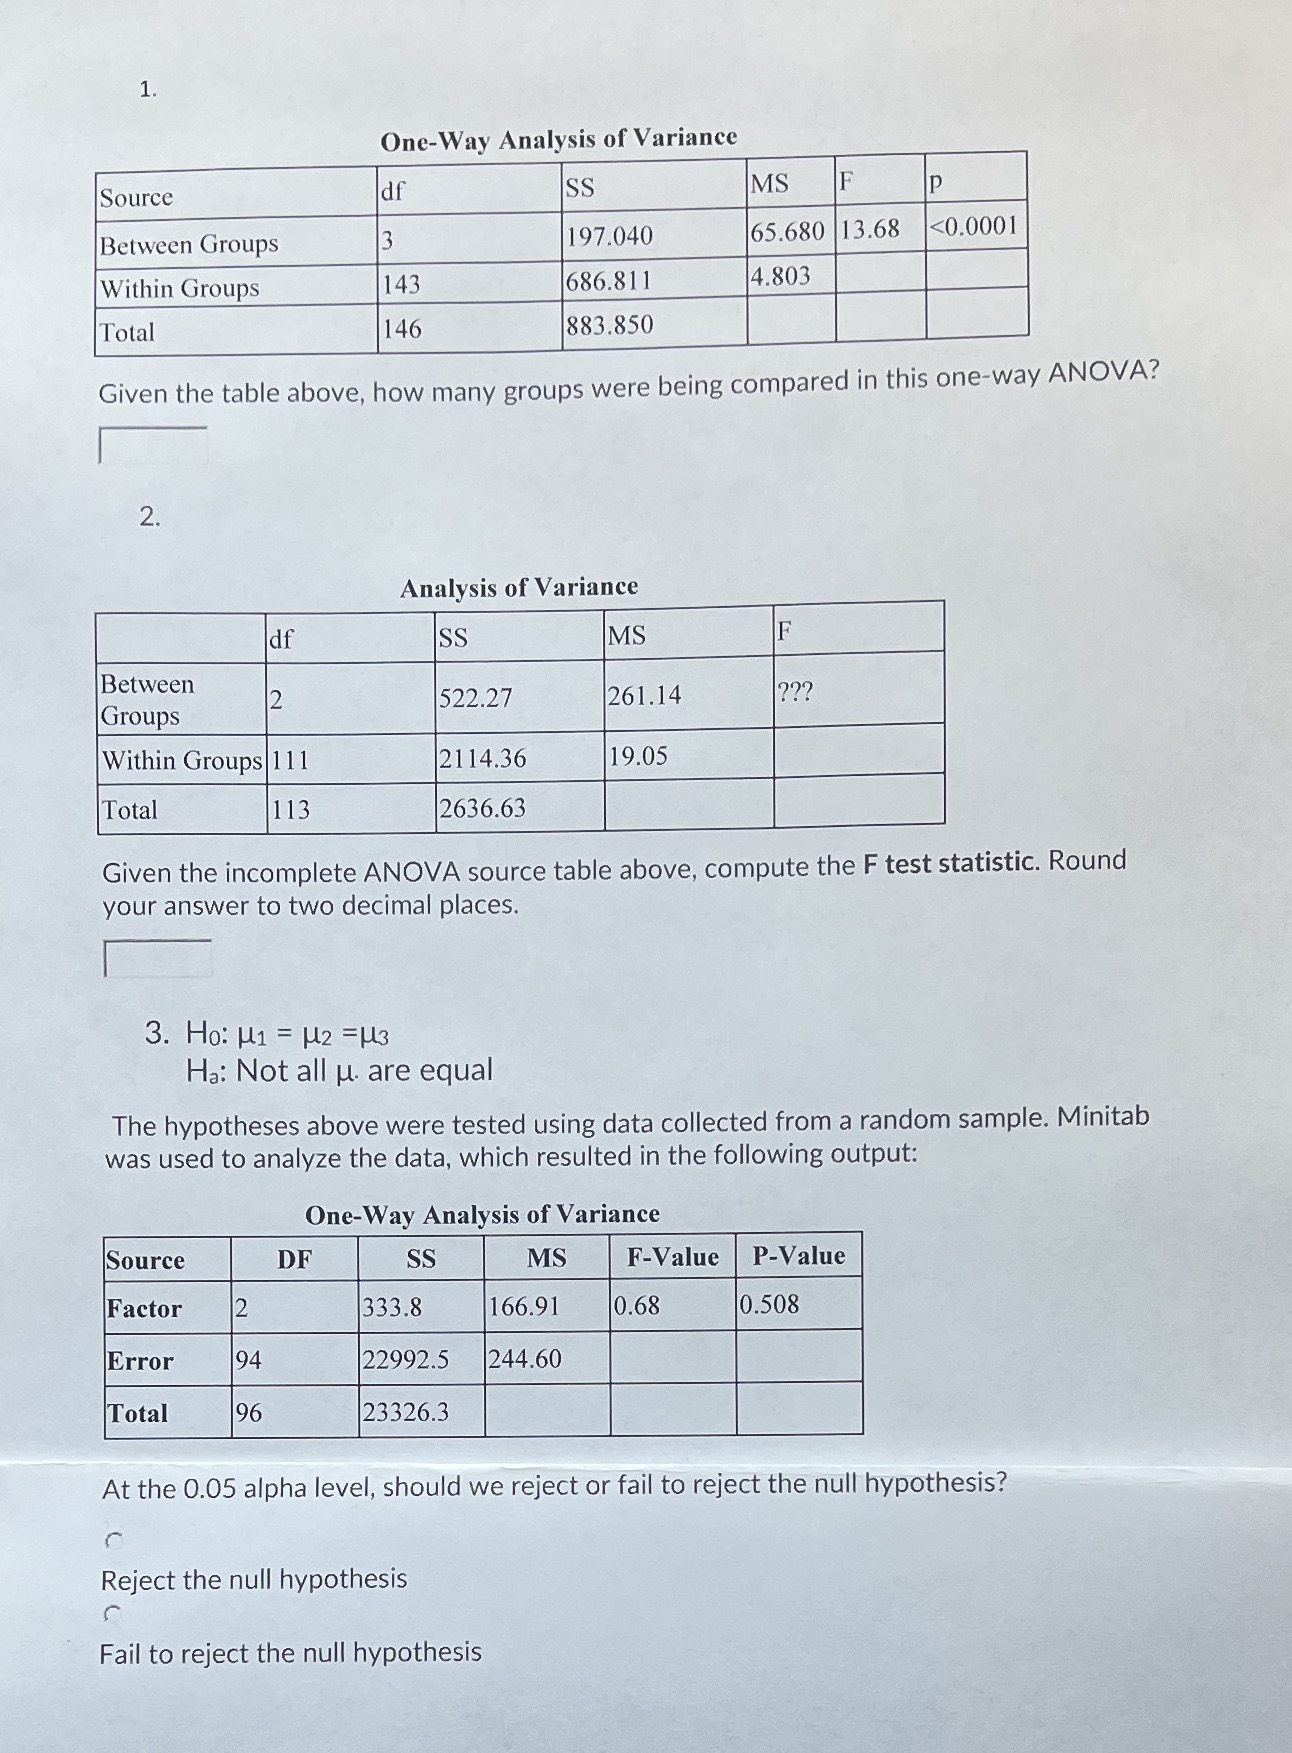
1. One-Way Analysis of Variance Source df SS MS F P Between Groups 3 197.040 65.680 13.68 0.0001 Within Groups 143 686.811 4.803 Total 146 883.850 Given the table above, how many groups were being compared in this one-way ANOVA? 2. Analysis of Variance df SS MS Between 2 261.14 ??? Groups 522.27 Within Groups 111 2114.36 19.05 Total 113 2636.63 Given the incomplete ANOVA source table above, compute the F test statistic. Round your answer to two decimal places. 3. Ho: H1 = 12 = M3 Ha: Not all u. are equal The hypotheses above were tested using data collected from a random sample. Minitab was used to analyze the data, which resulted in the following output: One-Way Analysis of Variance Source DF SS MS F-Value P-Value Factor 2 333.8 166.91 0.68 0.508 Error 94 22992.5 244.60 Total 96 23326.3 At the 0.05 alpha level, should we reject or fail to reject the null hypothesis? C Reject the null hypothesis Fail to reject the null hypothesis
Step by Step Solution
There are 3 Steps involved in it

Get step-by-step solutions from verified subject matter experts