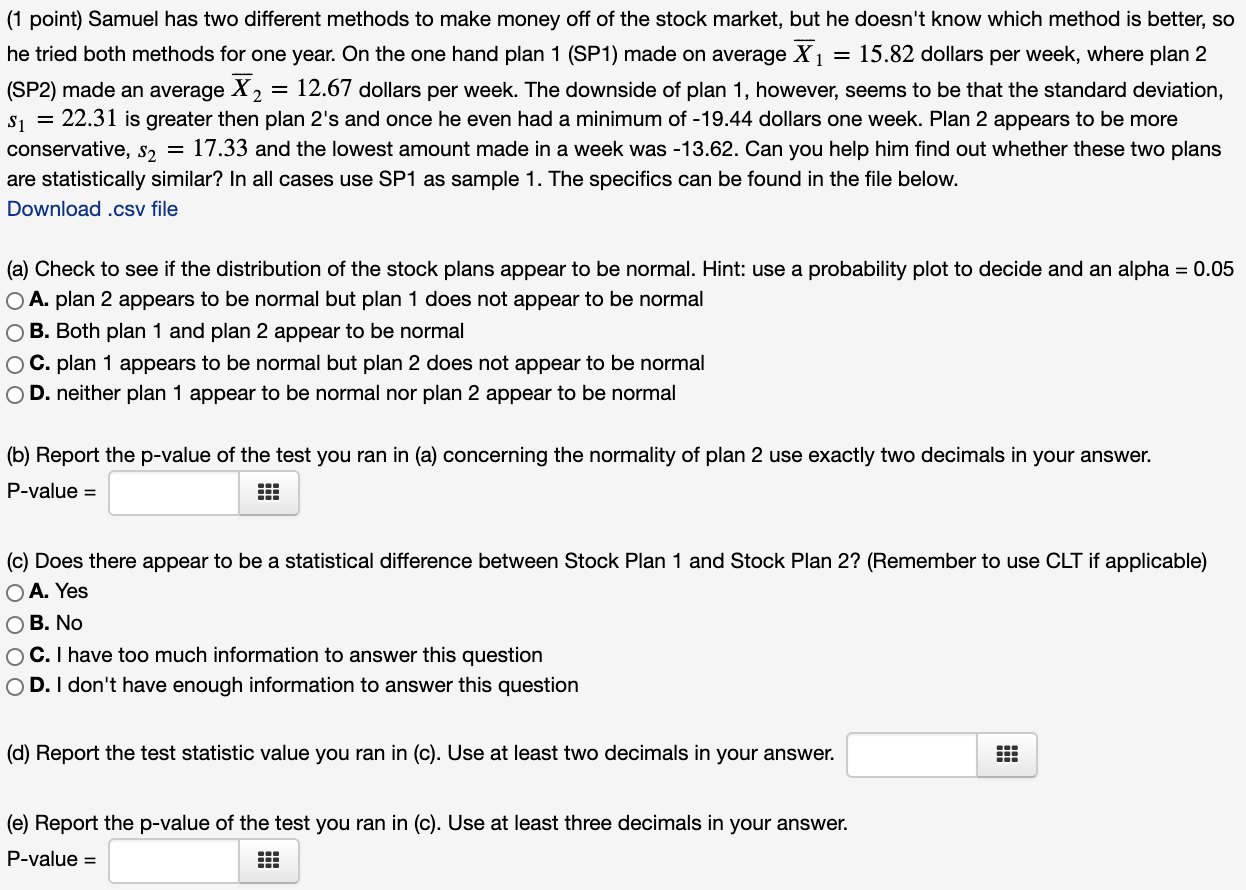
Question: (1 point) Samuel has two different methods to make money off of the stock market, but he doesn't know which method is better, so he

(1 point) Samuel has two different methods to

(1 point) Samuel has two different methods to make money off of the stock market, but he doesn't know which method is better, so he tried both methods for one year. On the one hand plan 1 (SP1) made on average X 1 = 15.82 dollars per week, where plan 2 (SP2) made an average X 2 = 12.67 dollars per week. The downside of plan 1, however, seems to be that the standard deviation, S1 22.31 is greater then plan 2's and once he even had a minimum of -19.44 dollars one week. Plan 2 appears to be more conservative, s2 = 17.33 and the lowest amount made in a week was -13.62. Can you help him find out whether these two plans are statistically similar? In all cases use SP1 as sample 1. The specifics can be found in the file below. Download .csv file = (a) Check to see if the distribution of the stock plans appear to be normal. Hint: use a probability plot to decide and an alpha = 0.05 O A. plan 2 appears to be normal but plan 1 does not appear to be normal OB. Both plan 1 and plan 2 appear to be normal OC. plan 1 appears to be normal but plan 2 does not appear to be normal OD. neither plan 1 appear to be normal nor plan 2 appear to be normal (b) Report the p-value of the test you ran in (a) concerning the normality of plan 2 use exactly two decimals in your answer. P-value = (c) Does there appear to be a statistical difference between Stock Plan 1 and Stock Plan 2? (Remember to use CLT if applicable) O A. Yes OB. No OC. I have too much information to answer this question OD. I don't have enough information to answer this question (d) Report the test statistic value you ran in (c). Use at least two decimals in your answer. (e) Report the p-value of the test you ran in (c). Use at least three decimals in your answer. P-value = (1 point) Samuel has two different methods to make money off of the stock market, but he doesn't know which method is better, so he tried both methods for one year. On the one hand plan 1 (SP1) made on average X 1 = 15.82 dollars per week, where plan 2 (SP2) made an average X 2 = 12.67 dollars per week. The downside of plan 1, however, seems to be that the standard deviation, S1 22.31 is greater then plan 2's and once he even had a minimum of -19.44 dollars one week. Plan 2 appears to be more conservative, s2 = 17.33 and the lowest amount made in a week was -13.62. Can you help him find out whether these two plans are statistically similar? In all cases use SP1 as sample 1. The specifics can be found in the file below. Download .csv file = (a) Check to see if the distribution of the stock plans appear to be normal. Hint: use a probability plot to decide and an alpha = 0.05 O A. plan 2 appears to be normal but plan 1 does not appear to be normal OB. Both plan 1 and plan 2 appear to be normal OC. plan 1 appears to be normal but plan 2 does not appear to be normal OD. neither plan 1 appear to be normal nor plan 2 appear to be normal (b) Report the p-value of the test you ran in (a) concerning the normality of plan 2 use exactly two decimals in your answer. P-value = (c) Does there appear to be a statistical difference between Stock Plan 1 and Stock Plan 2? (Remember to use CLT if applicable) O A. Yes OB. No OC. I have too much information to answer this question OD. I don't have enough information to answer this question (d) Report the test statistic value you ran in (c). Use at least two decimals in your answer. (e) Report the p-value of the test you ran in (c). Use at least three decimals in your answer. P-value =

Step by Step Solution

There are 3 Steps involved in it

1 Expert Approved Answer
Step: 1 Unlock blur-text-image
Question Has Been Solved by an Expert!

Get step-by-step solutions from verified subject matter experts

Step: 2 Unlock
Step: 3 Unlock

Students Have Also Explored These Related General Management Questions!