

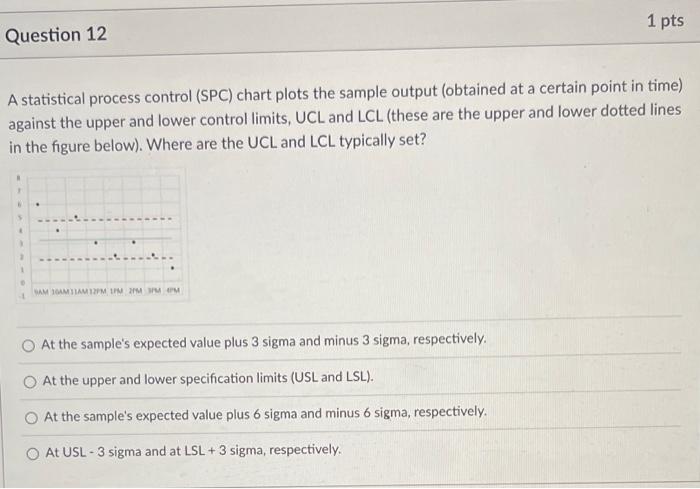
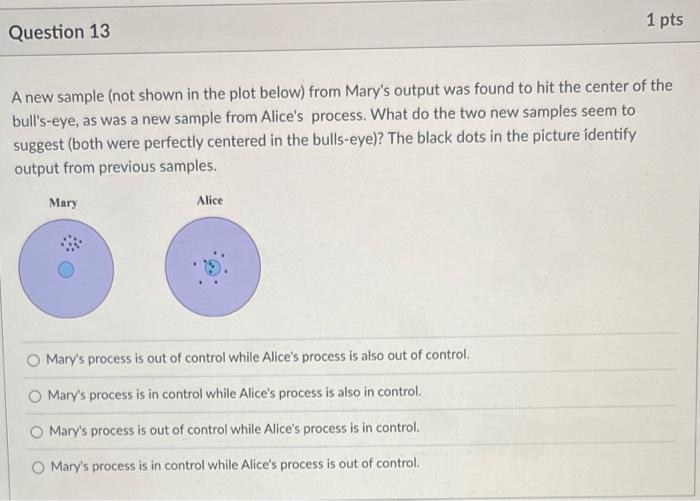
Question: 1 pts Question 12 A statistical process control (SPC) chart plots the sample output (obtained at a certain point in time) against the upper and
Step by Step Solution
There are 3 Steps involved in it
1 Expert Approved Answer
Step: 1 Unlock

Question Has Been Solved by an Expert!
Get step-by-step solutions from verified subject matter experts
Step: 2 Unlock
Step: 3 Unlock