

Question: A statistical process control (SPC) chart plots the sample output (obtained at a certain point in time) against the upper and lower control limits, UCL
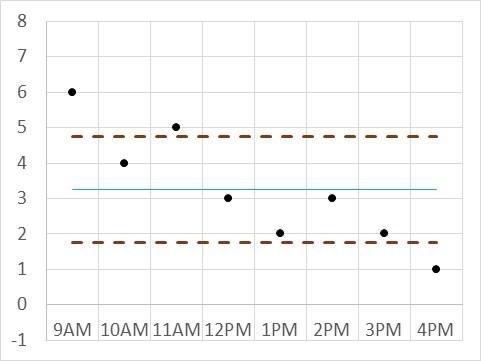
A statistical process control (SPC) chart plots the sample output (obtained at a certain point in time) against the upper and lower control limits, UCL and LCL (these are the upper and lower dotted lines in the figure below). The figure below shows the sample output at 9 am, 10 am, ..., through 4 pm. Which of the samples suggests the process is "out of control?"
Group of answer choices
The samples at 10 am, 12 pm, 1 pm, 2 pm, and 3 pm
The samples at 9 am and 11 am and 4 pm
Only the sample at 4 pm
Only the samples at 9 am and 11 am
Step by Step Solution
There are 3 Steps involved in it
1 Expert Approved Answer
Step: 1 Unlock

Question Has Been Solved by an Expert!
Get step-by-step solutions from verified subject matter experts
Step: 2 Unlock
Step: 3 Unlock