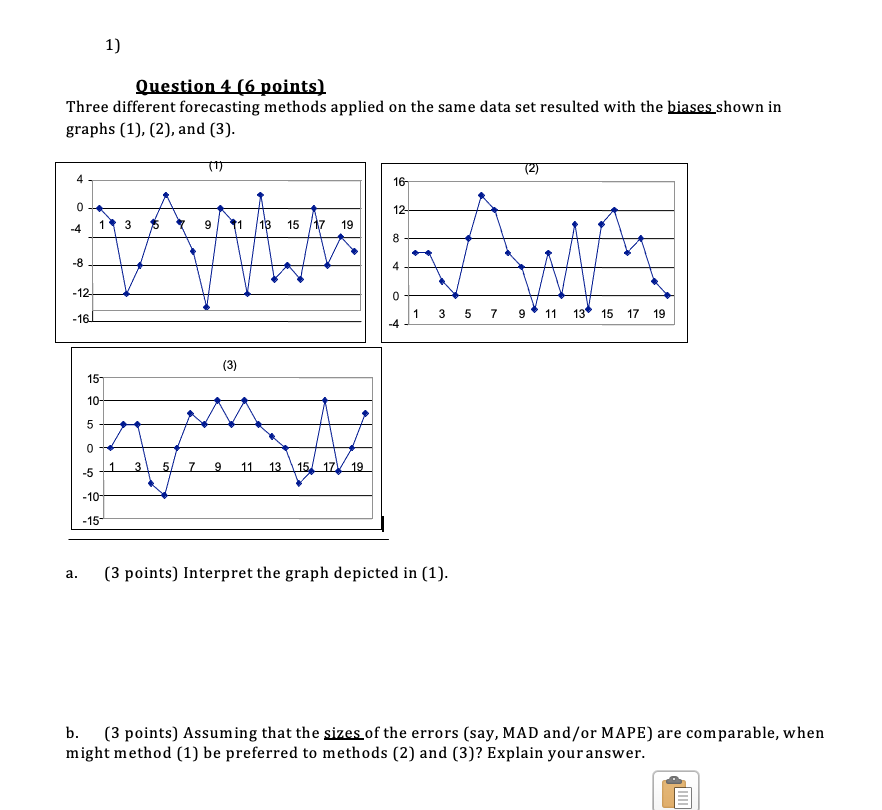
Question: 1) Question 4 (6 points) Three different forecasting methods applied on the same data set resulted with the biases shown in graphs (1), (2), and

1) Question 4 (6 points) Three different

1) Question 4 (6 points) Three different forecasting methods applied on the same data set resulted with the biases shown in graphs (1), (2), and (3). (2) 16 0 12 4 1 3 1 13 15 17 19 8 -8 4 -12 0 1 3 5 7 9 11 13 15 -16. 17 19 4 (3) 15 10- 5 0 1 3 5/ 7 9 11 13 -5 15 17 19 -10 -15- a. (3 points) Interpret the graph depicted in (1). b. (3 points) Assuming that the sizes of the errors (say, MAD and/or MAPE) are comparable, when might method (1) be preferred to methods (2) and (3)? Explain your

Step by Step Solution

There are 3 Steps involved in it

1 Expert Approved Answer
Step: 1 Unlock blur-text-image
Question Has Been Solved by an Expert!

Get step-by-step solutions from verified subject matter experts

Step: 2 Unlock
Step: 3 Unlock

Students Have Also Explored These Related General Management Questions!