

Question: 1. Quick Ratio (2003): 2. Current Ratio (2003): 3. Current Liabilities to Net Worth: 1. Based on average of 2002 and 2003 4. Debt to
1. Quick Ratio (2003):
2. Current Ratio (2003):
3. Current Liabilities to Net Worth: 1. Based on average of 2002 and 2003
4. Debt to Equity (2003):
5. Fixed Assets to Net Worth (2003):
6. Current Assets to Total Assets (2003):
7. Collection Period: 1. Based on average of 2002 and 2003; calculate with and without retainage
8. Receivable Turns (base on Q7 answers): 1. With and without retainage
9. Average Age of Accounts Payable: 1. Base on average of 2002 and 2003
10. Payable Turns (base on Q9 answers): 11.Assets to Revenues: 1. Base on average of 2002 and 2003
12. Working Capital (combined total for 2003 and 2002): 13.Accounts Payable to Revenue: 1. Base on average of 2002 and 2003
14. Gross Profit Margin (2003):
15. General Overhead Ratio (2003):
16. Profit (Income) Margin (2003):
17.Return on Assets: 1. Base on average of 2002 and 2003
18.Return on Investment (the unearned compensation): 1. Base on average of 2002 and 2003 total equity
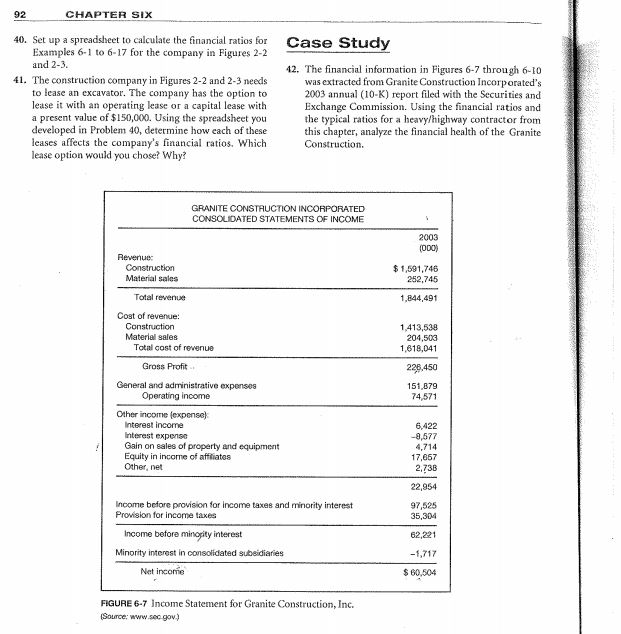
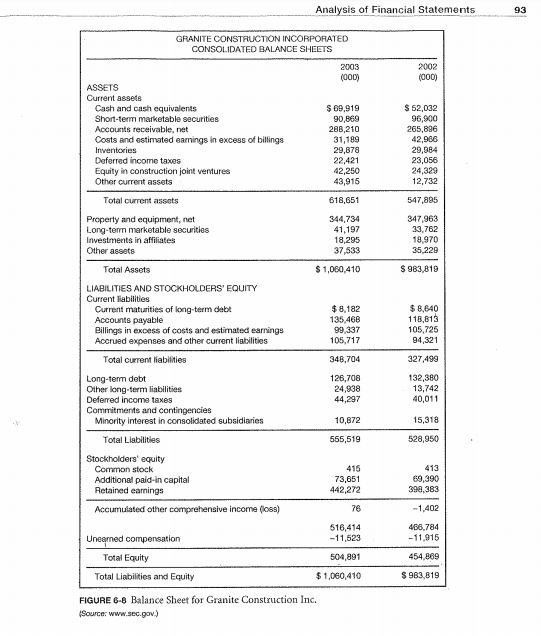
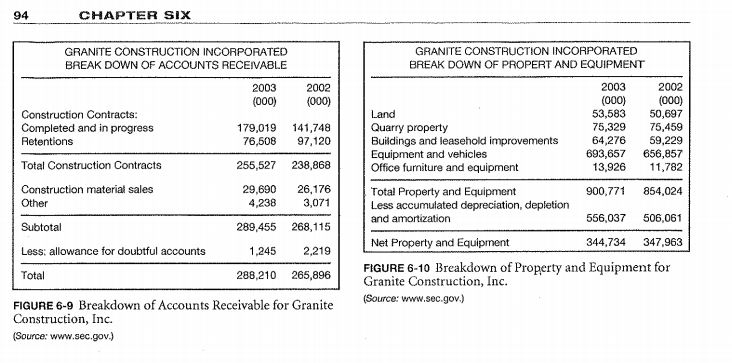
92 CHAPTER SIX 40. Set up a spreadsheet to calculate the financial ratios for Examples 6-1 to 6-17 for the company in Figures 2-2 and 2-3. 41. The construction company in Figures 2-2 and 2-3 needs to lease an excuvator. The company has the option to lease it with an operating lease or a capital lease with a present value of $150,000. Using the spreadsheet you developed in Problem 40, determine how each of these leases affects the company's financial ratios. Which lease option would you chose? Why? Case Study 42. The financial information in Figures 6-7 through 6-10 was extracted from Granite Construction Incorporated's 2003 annual (10-K) report filed with the Securities and Exchange Commission. Using the financial ratios and the typical ratios for a heavy/highway contractor from this chapter, analyze the financial health of the Granite Construction. GRANITE CONSTAUCTION INCORPORATED CONSOLIDATED STATEMENTS OF INCOME 2003 (000) Revenue: Construction Material sales $ 1,591,746 252,745 1,844,491 Total revenue Cost of revenue: Construction Material sales Total cost of revenue 1,413,538 204,503 1,618,041 228.450 151,879 74,571 Gross Profit General and administrative expenses Operating income Other income (expense) Interest income Interest expense Gain on sales of property and equipment Equity in income of affiliates Othernet 6,422 -8,677 4,714 17,667 2,736 22,954 Income before provision for Income taxes and minority interest Provision for income taxes Income before minority interest Minority interest in consolidated subsidiaries Net income 97,525 35,304 62,221 -1,717 $ 60,504 FIGURE 6-7 Income Statement for Granite Construction, Inc. (Source: www.sec.gov.) Analysis of Financial Statements 93 GRANITE CONSTRUCTION INCORPORATED CONSOLIDATED BALANCE SHEETS 2003 (000) 2002 (000) ASSETS Current assets Cash and cash equivalents Short-term marketable securities Accounts receivable.net Costs and estimated earnings in excess of billings Inventories Deferred income taxes Equity in construction joint ventures Other current assets $ 69,919 90,869 288,210 31,189 29,878 22,421 42,250 43,916 $ 52,032 96,900 265,896 42,986 29,384 23,056 24,329 12,732 618,651 547.895 344,734 41,197 18,295 37,533 347,963 33,762 18,970 35,229 $ 1,060,410 $983,819 $8.182 135,466 99,337 105,717 $8,840 118,813 105,725 94,321 Total current assets Property and equipment, net Long-term marketable securities Investments in affiliates Other assets Total Assets LIABILITIES AND STOCKHOLDERS' EQUITY Current liabilities Current maturities of long-term debt Accounts payable Billings in excess of costs and estimated earrings Accrued expenses and other current liabilities Total current liabilities Long-term debt Other long term liabilities Deferred Income taxes Commitments and contingencies Minority Interest in consolidated subsidiaries Total Liabilities Stockholders' equity Common stock Additional paid-in capital Retained earnings Accumulated other comprehensive income foss) 348,704 126,708 24,938 44,297 327,499 132,380 13,742 40,011 10,872 15,318 555,519 528,950 413 415 73,651 442,272 76 69,390 398,383 - 1.402 516,414 -11,523 466.784 -11,915 Uneamed compensation Total Equity Total Liabilities and Equity 504,891 454,869 $ 983,819 $1,060,410 FIGURE 6-8 Balance Sheet for Granite Construction Inc. (Source: www.sec.gov.) 94 CHAPTER SIX GRANITE CONSTRUCTION INCORPORATED BREAK DOWN OF ACCOUNTS RECEIVABLE 2003 2002 (000) (000) Construction Contracts: Completed and in progress 179,019 141,748 Retentions 76,608 97,120 Total Construction Contracts 255,527 238,868 GRANITE CONSTRUCTION INCORPORATED BREAK DOWN OF PROPERT AND EQUIPMENT 2003 2002 (000) (000) Land 53,583 50,697 Quarry property 75,329 75,459 Buildings and leasehold improvements 64,276 59,229 Equipment and vehicles 693,657 656,857 Office furniture and equipment 13,926 11,782 Total Property and Equipment 900,771 854,024 Less accumulated depreciation, depletion and amortization 556,037 506,061 Net Property and Equipment 344,734 347,963 FIGURE 6-10 Breakdown of Property and Equipment for Granite Construction, Inc. (Source: www.sec.gov.) Construction material sales Other 29,690 4,238 26,176 3,071 Subtotal 289,455 268,115 Less: allowance for doubtful accounts 1,245 2,219 Total 288,210 265,896 FIGURE 6-9 Breakdown of Accounts Receivable for Granite Construction, Inc. (Source: www.sec.gov.)
Step by Step Solution
There are 3 Steps involved in it

Get step-by-step solutions from verified subject matter experts