

Question: 1 Risk and Return (10 Points) Table 1 represents 6 different stocks available to you with their respective expected returns and standard deviations. Table 1:
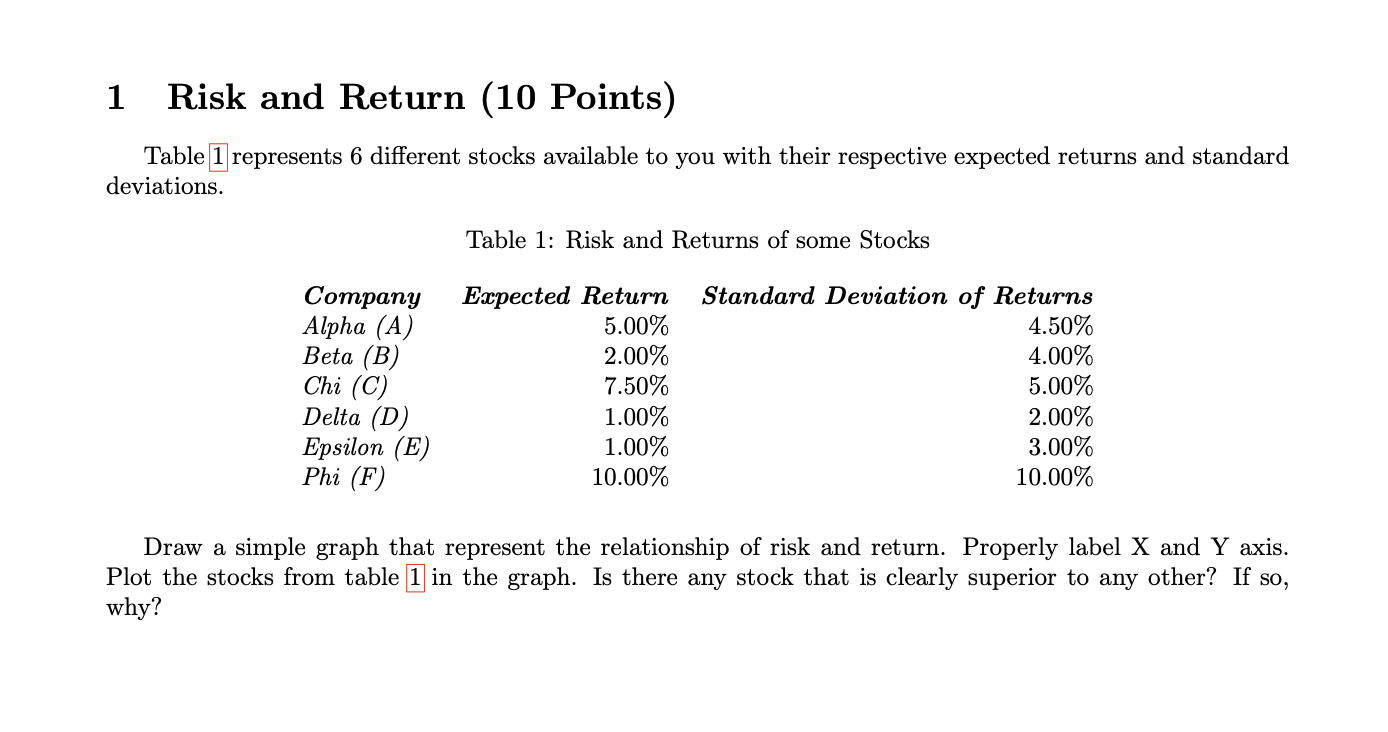
1 Risk and Return (10 Points) Table 1 represents 6 different stocks available to you with their respective expected returns and standard deviations. Table 1: Risk and Returns of some Stocks Company Alpha (A) Beta (B) Chi (C) Delta (D) Epsilon (E) Phi (F) Expected Return 5.00% 2.00% 7.50% 1.00% 1.00% 10.00% Standard Deviation of Returns 4.50% 4.00% 5.00% 2.00% 3.00% 10.00% Draw a simple graph that represent the relationship of risk and return. Properly label X and Y axis. Plot the stocks from table 1 in the graph. Is there any stock that is clearly superior to any other? If so, why
Step by Step Solution
There are 3 Steps involved in it
1 Expert Approved Answer
Step: 1 Unlock

Question Has Been Solved by an Expert!
Get step-by-step solutions from verified subject matter experts
Step: 2 Unlock
Step: 3 Unlock