

Question: 1. Select the best answer regarding your observation a. both s(t) and b(t) appear as identical sine waves b. both s(t) and b(t) appear as
1.
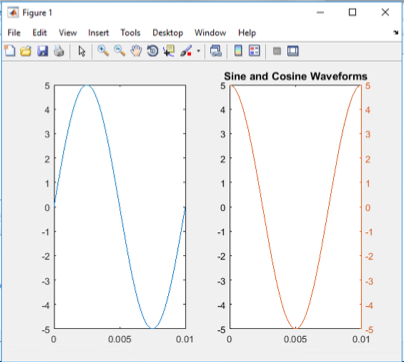
Select the best answer regarding your observation
| a. both s(t) and b(t) appear as identical sine waves | ||
| b. both s(t) and b(t) appear as identical cosine waves | ||
| c. s(t) appears as a sine wave while b(t) appears as a cosine wave | ||
| d. s(t) appears as a cosine wave while b(t) appears as a sine wave |
2.
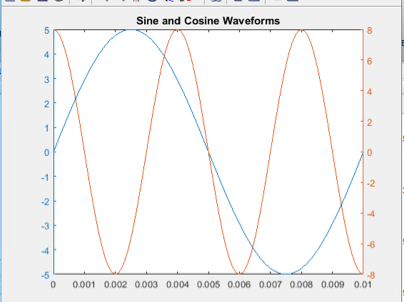
What are the differences between the two plots a(t) and b(t)
| a. a(t) and b(t) have the same amplitudes | ||
| b. a(t) has a higher frequency than b(t) | ||
| c. a(t) and b(t) appear as identical plots | ||
| d. For every single cycle for a(t), two cycles of b(t) are seen |
3.
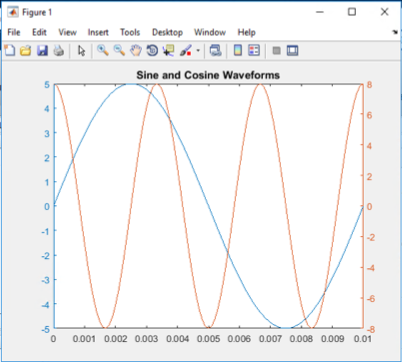
Select the correct observation for a(t) and b(t)
| a. plots are same in amplitude | ||||||||||||||||||||||||||
| b. plots are same in frequency | ||||||||||||||||||||||||||
| c. since a(t) and b(t) phase angles are 0, a(t) appears as a sinewave that lags b(t), which is a cosine wave | ||||||||||||||||||||||||||
| d. both b and c are correct
4.
Having changed the message amplitude to Am=50, select the correct statement
|
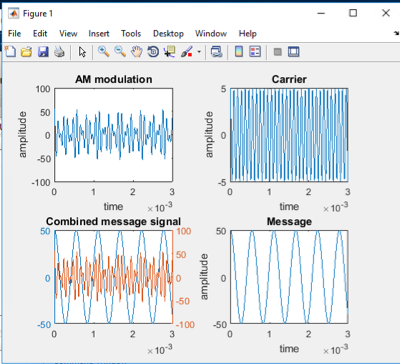
Figure 1 File Edit View Insert Tools Desktop Window Help Sine and Cosine Waveforms -1 -2 .2 -3 -3 0.005 -5 0.01 0.005 0.01
Step by Step Solution
There are 3 Steps involved in it

Get step-by-step solutions from verified subject matter experts