

Question: Q1. Step 1.9 Using the MatLab code in step 1.8, modify the following: (1) s(t) = s=A1*sin((2pi*f1*t)+sphase) = 3sin(21t300t + 1/2) (2) b(t) = b=A2*cos((2*pi*f2*t)+bphase)
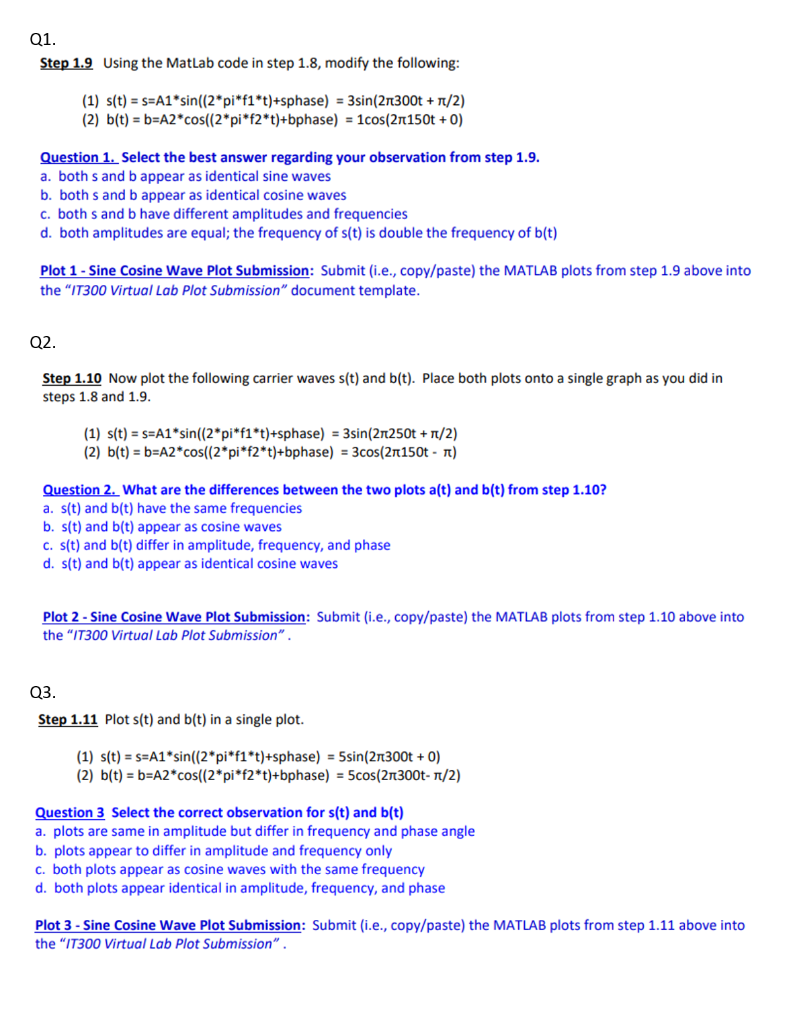
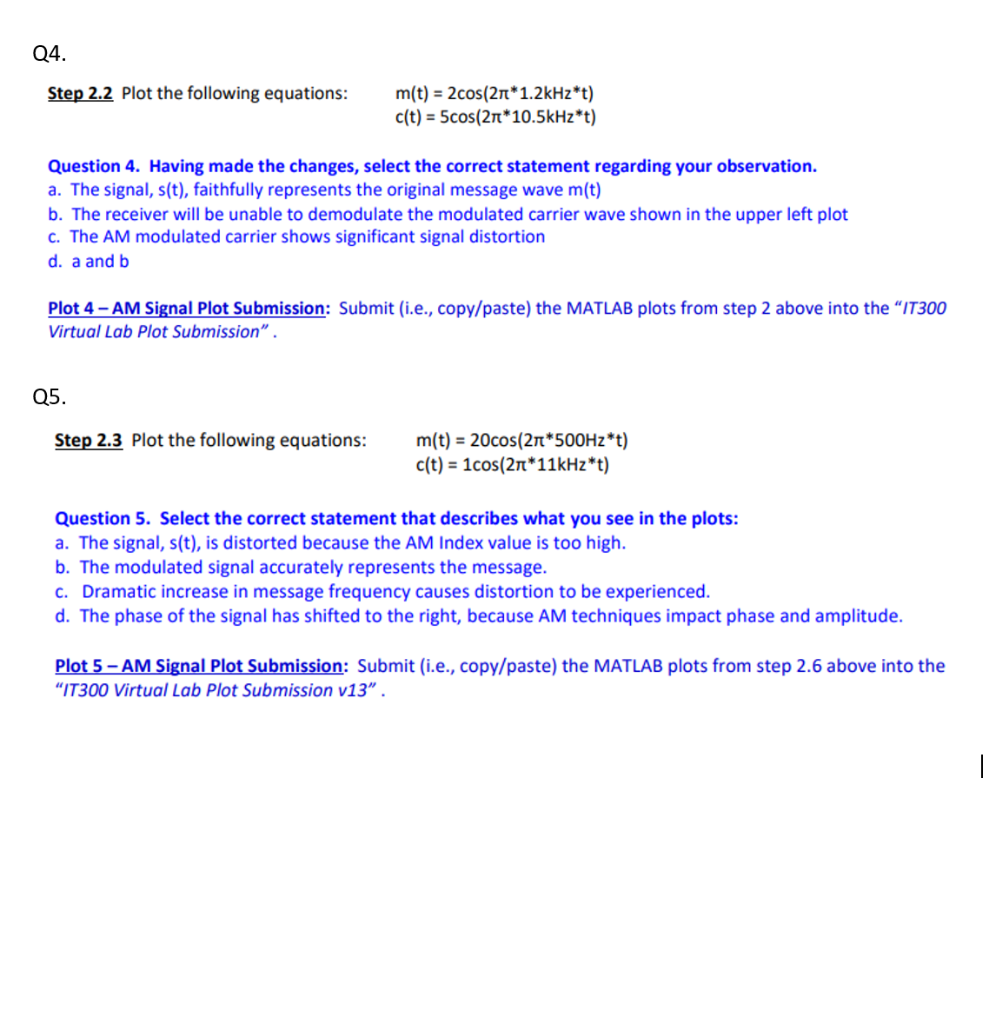
Q1. Step 1.9 Using the MatLab code in step 1.8, modify the following: (1) s(t) = s=A1*sin((2pi*f1*t)+sphase) = 3sin(21t300t + 1/2) (2) b(t) = b=A2*cos((2*pi*f2*t)+bphase) = 1cos(21t150t +O) Question 1. Select the best answer regarding your observation from step 1.9. a. both s and b appear as identical sine waves b. both s and b appear as identical cosine waves c. both s and b have different amplitudes and frequencies d. both amplitudes are equal; the frequency of s(t) is double the frequency of b(t) Plot 1 - Sine Cosine Wave Plot Submission: Submit (i.e., copy/paste) the MATLAB plots from step 1.9 above into the "IT300 Virtual Lab Plot Submission" document template. Q2. Step 1.10 Now plot the following carrier waves s(t) and (t). Place both plots onto a single graph as you did in steps 1.8 and 1.9. (1) s(t) = 5=A1* sin((2* pi*f1*t)+sphase) = 3sin(211250t + 1/2) (2) b(t) = b=A2*cos((2 *pi*f2*t)+bphase) = 3 cos(21150t - 1) Question 2. What are the differences between the two plots a(t) and (t) from step 1.10? a. s(t) and b(t) have the same frequencies b. s(t) and b(t) appear as cosine waves C. s(t) and b(t) differ in amplitude, frequency, and phase d. s(t) and b(t) appear as identical cosine waves Plot 2 - Sine Cosine Wave Plot Submission: Submit (i.e., copy/paste) the MATLAB plots from step 1.10 above into the "IT300 Virtual Lab Plot Submission". Q3. Step 1.11 Plot s(t) and b(t) in a single plot. (1) s(t) = S=A1* sin((2*pi*f1*t)+sphase) = 5sin(21300t + 0) (2) b(t) = b=A2*cos((2*pi*f2*t)+bphase) = 5cos(21t300-1/2) Question 3 Select the correct observation for s(t) and b(t) a. plots are same in amplitude but differ in frequency and phase angle b. plots appear to differ in amplitude and frequency only c. both plots appear as cosine waves with the same frequency d. both plots appear identical in amplitude, frequency, and phase Plot 3 - Sine Cosine Wave Plot Submission: Submit (i.e., copy/paste) the MATLAB plots from step 1.11 above into the "IT300 Virtual Lab Plot Submission". Q4. Step 2.2 Plot the following equations: m(t) = 2cos(21*1.2kHz*t) c(t) = 5cos(21*10.5kHz*t) Question 4. Having made the changes, select the correct statement regarding your observation. a. The signal, s(t), faithfully represents the original message wave m(t) b. The receiver will be unable to demodulate the modulated carrier wave shown in the upper left plot C. The AM modulated carrier shows significant signal distortion d. a and b Plot 4 - AM Signal Plot Submission: Submit (i.e., copy/paste) the MATLAB plots from step 2 above into the IT300 Virtual Lab Plot Submission". Q5. Step 2.3 Plot the following equations: m(t) = 20cos(212*500Hz*t) c(t) = 1cos(211*11kHz*t) Question 5. Select the correct statement that describes what you see in the plots: a. The signal, s(t), is distorted because the AM Index value is too high. b. The modulated signal accurately represents the message. C. Dramatic increase in message frequency causes distortion to be experienced. d. The phase of the signal has shifted to the right, because AM techniques impact phase and amplitude. Plot 5 - AM Signal Plot Submission: Submit (i.e., copy/paste) the MATLAB plots from step 2.6 above into the "IT300 Virtual Lab Plot Submission v13
Step by Step Solution
There are 3 Steps involved in it

Get step-by-step solutions from verified subject matter experts