

Question: 1. Smoothing constant0.15 (1)Based on the given information, please compute a four-period average forecast for Week 7 to Week 11 with the approaches of moving
1.
Smoothing constant0.15
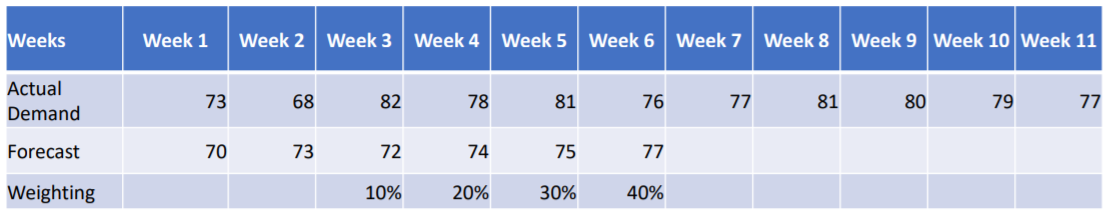
(1)Based on the given information, please compute a four-period average forecast for Week 7 to Week 11 with the approaches of moving average, weighted moving average, and exponential smoothing. (with accuracy to two decimal places) Remark: The answers should demonstrate the process of how to obtain the results.
(2)Based on the results of the above question, compare the error performance of these three forecasting techniques using MAD, MSE, and MAPE for the three approaches and identify the best approach for MAD, MSE, and MAPE, respectively. (with accuracy to two decimal places) Remark: The answers should demonstrate the process of how to obtain the results.
2.A 25% rise is predicted for the demand in 2020 based on the annual output of 944 units in 2019. Quarter relatives are Q1 = 1.1; Q2= 0.6; Q3= 1.6; and Q4 = 0.8. What is the forecast for the third quarter of 2020? Remark: The answers should demonstrate the process of how to obtain the results.
3.
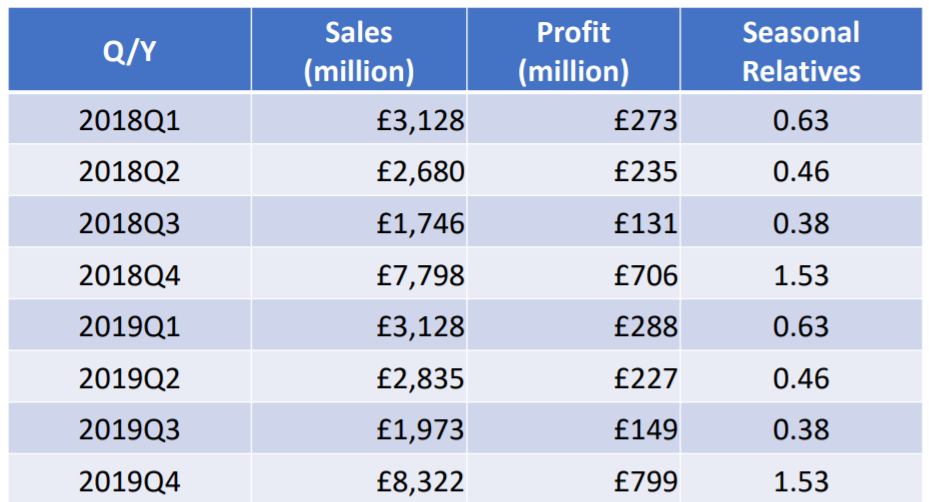
ABC Medical Group wants to develop the quarterly forecast of sales revenue of 2020 with data of 2018 and 2019 together with the seasonality relatives.
Remark: The answers should demonstrate the process of how to obtain the results together with the graphics generated by Excel for constructing the linear regression models and the linear regression equations.
(1) Please deseasonalize the sales revenue of the eight quarters from 2018 to 2019 according to the given information.
(2)Based on the given data, please identify the linear regression equation for the relationship between the sales revenue and profit. According to the findings, please advise the sales revenue if the quarterly target profit is 800 million.
(3) Please plot the data, and visually check to see if a linear trend line would be appropriate for the sales revenue. Then determine the equation of the trend line and predict sales revenue for the last two quarters of 2020.
(4)Please incorporate seasonality to the forecast in Question (3).
Weeks Week 1 Week 2 Week 3 Week 4 Week 5 Week 6 Week 7 Week 8 Week 9 Week 10 Week 11 Actual Demand 73 68 82 78 81 76 77 81 80 79 77 Forecast 70 73 72 74 75 77 Weighting 10% 20% 30% 40% Q/Y Sales (million) 3,128 2,680 Profit (million) 273 Seasonal Relatives 201801 0.63 2018Q2 235 0.46 2018Q3 1,746 131 0.38 201804 706 1.53 201901 7,798 3,128 2,835 288 0.63 2019Q2 227 0.46 2019Q3 1,973 149 0.38 201904 8,322 799 1.53Step by Step Solution
There are 3 Steps involved in it

Get step-by-step solutions from verified subject matter experts