

Question: ( 1 ) Sorting: Sort the data first in descending order of workload, and for those with the same workload, sort them in descending order
Sorting: Sort the data first in descending order of workload, and for those with the same workload, sort them in descending order of professional titles.
Automatic filtering: Filter out professors with a workload exceeding including
Advanced screening: Select female computer science teachers aged between and and male professors of any age group
Simple classification summary: Summarize the total workload completed by teachers by department
Nested classification summary: Based on summarize the number of male and female teachers in each department
Pivot table: statistics on the number of male and female teachers in various professional titles in various departments and colleges
Experimental Report
Excel
Experimental Purpose
Master the methods of simple sorting and multiple sorting;
Master the methods of automatic and advanced filtering;
Master the method of classification and summary;
Master the creation and formatting of charts;
Understand the basic composition of charts and the role of some options.
Experimental content and steps
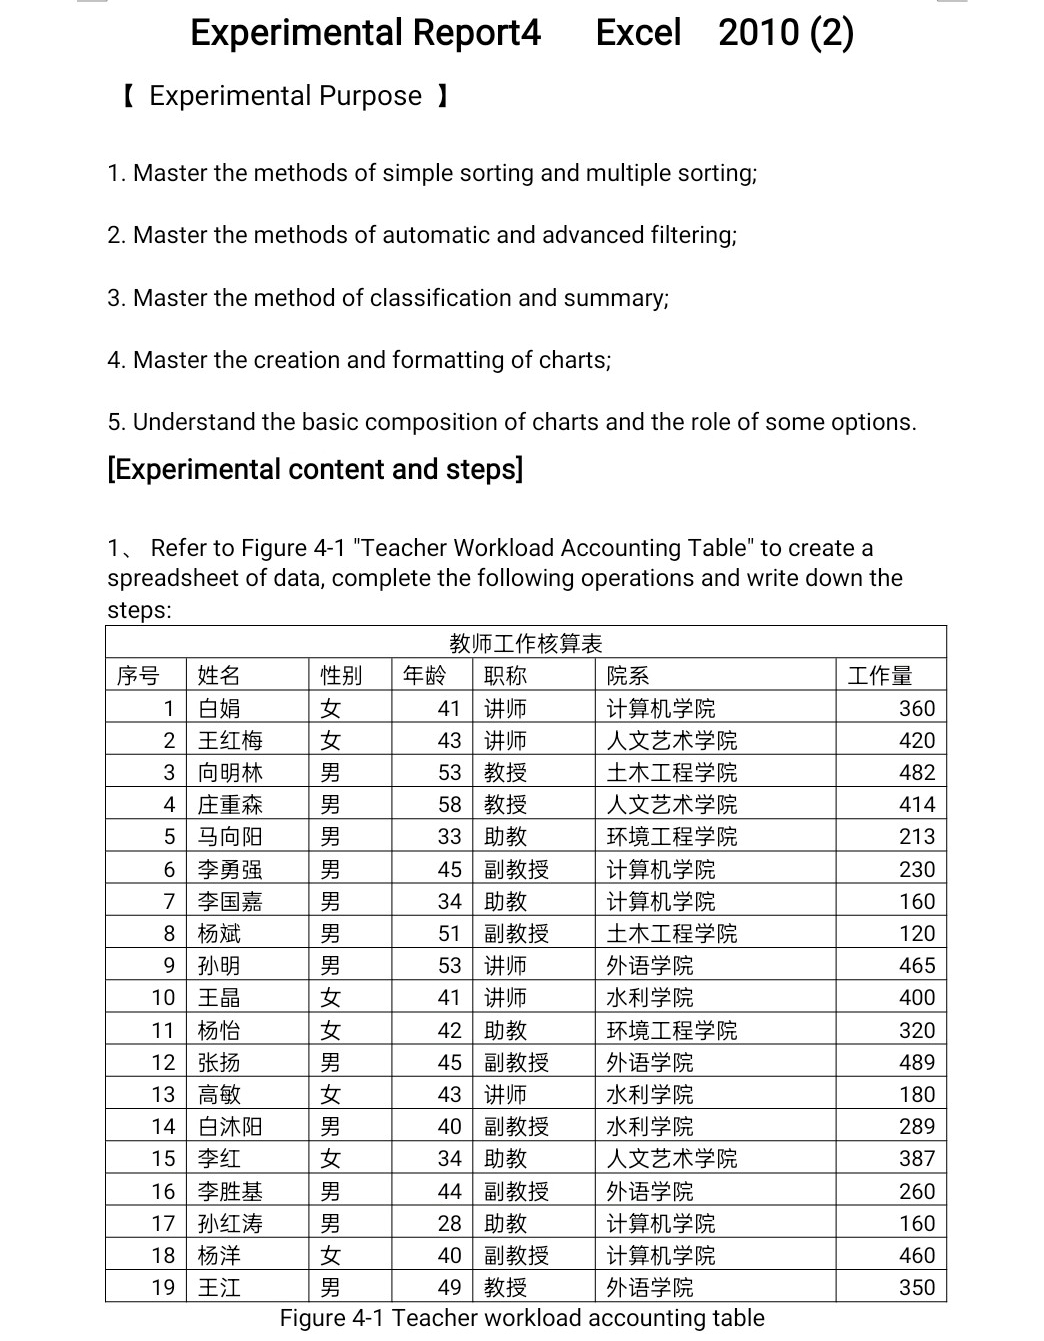
Refer to Figure "Teacher Workload Accounting Table" to create a spreadsheet of data, complete the following operations and write down the steps:
tabletabletable
Figure Teacher workload accounting table
Step by Step Solution
There are 3 Steps involved in it
1 Expert Approved Answer
Step: 1 Unlock

Question Has Been Solved by an Expert!
Get step-by-step solutions from verified subject matter experts
Step: 2 Unlock
Step: 3 Unlock