

Question: 1) Source 1: This graph below shows some information with regard to the price and the movement of the share price. a. What is this?
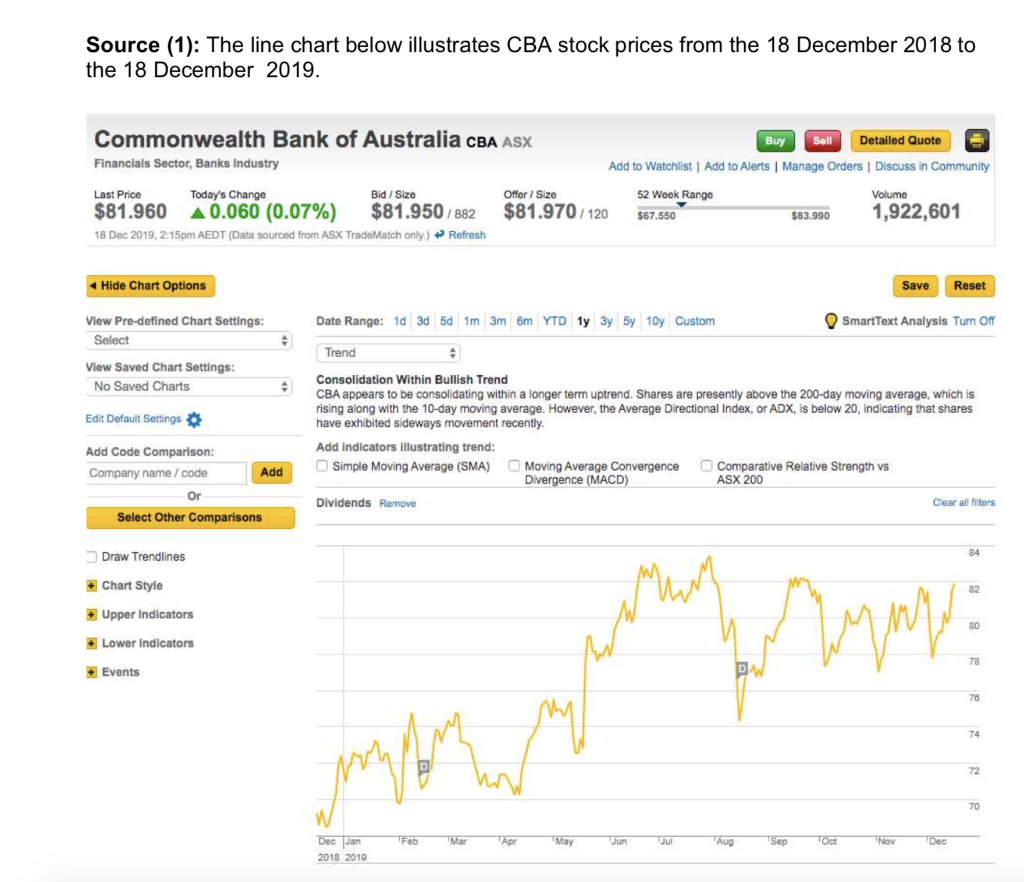
1) Source 1: This graph below shows some information with regard to the price and the movement of the share price.
a. What is this? ( look at pictures of source 1)
b. Is BHP a security?
c. What type of market is it traded in?
d. How is it different from a bond?
e. What should be the goal of a companys management?
f .What is the difference between debt and equity financing?
g. If Commonwealth bank lends money to Mary, is there an agency relationship between them? h. What is the difference between direct and indirect financing?
j. What is the difference between a commercial bank and an investment bank?
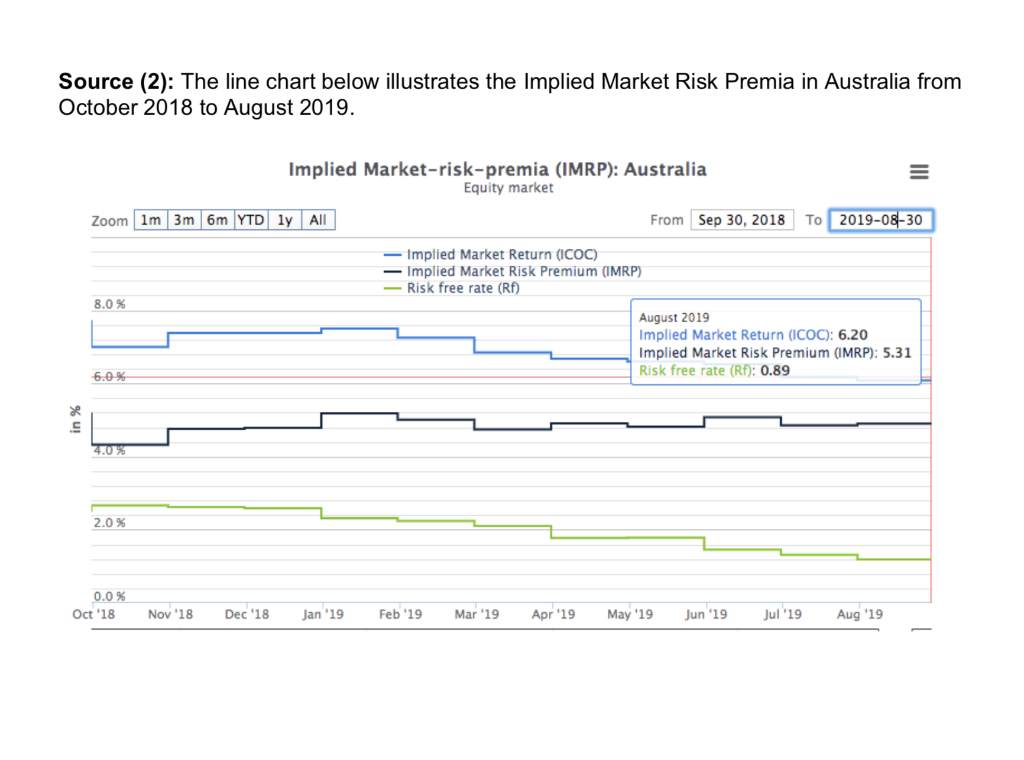
2) Source 2: Can you tell me about detail informations in the second graph ( source 2) below?( the source 2 is the representation of the real market risk premium in Australia. Of course , you did that capital asset pricing model which talk about risk free rate market risk premium and expected returns , the actual of value.
a. explain the theoretical basis of the Security Market Line (SML) and Outline the Capital Asset Pricing Model (CAPM) via source 2
Source (1): The line chart below illustrates CBA stock prices from the 18 December 2018 to the 18 December 2019. Commonwealth Bank of Australia CBA ASX Financials Sector, Banks Industry Buy Sell Detailed Quote Add to Watchlist | Add to Alerts Manage Orders Discuss in Community Offer / Size Volume Last Price Today's Change Bid / Size $81.960 0.060 (0.07%) $81.950/882 18 Dec 2019, 2:15pm AEDT (Data sourced from ASX TradeMatch only) Refresh $81.970/120 52 Week Range 567.550 - $83.990 1,922,601 Hide Chart Options Save Reset Date Range: 1d 3d 5d 1m 3m 6m YTD 1y 3y 5y 10y Custom SmartText Analysis Turn Off View Pre-defined Chart Settings: Select Trend View Saved Chart Settings: No Saved Charts Consolidation Within Bullish Trend CBA appears to be consolidating within a longer term uptrend. Shares are presently above the 200-day moving average, which is rising along with the 10-day moving average. However, the Average Directional Index, or ADX, is below 20, indicating that shares have exhibited sideways movement recently. Edit Default Settings Add Code Comparison: Company name / code Add Indicators Illustrating trend: Simple Moving Average (SMA) Add Moving Average Convergence Divergence (MACD) Comparative Relative Strength vs ASX 200 Or Dividends Remove Clear all filters Select Other Comparisons Draw Trendlines + Chart Style + Upper Indicators + Lower Indicators + Events Deo Jan 2018 2019 Feb Mar Apr May Jun Jul Aug Sep Oct Nov Dec Source (2): The line chart below illustrates the Implied Market Risk Premia in Australia from October 2018 to August 2019. Zoom 1m Implied Market-risk-premia (IMRP): Australia Equity market 3m 6m YTD 1y All From Sep 30, 2018 - Implied Market Return (COC) Implied Market Risk Premium (IMRP) Risk free rate (RF) TO 2019-08-30 8.0% August 2019 Implied Market Return (COC): 6.20 Implied Market Risk Premium (IMRP): 5.31 Risk free rate (RF): 0.89 in % 0.0% Oct '18 Nov '18 Dec '18 Jan '19 Feb '19 Mar '19 Apr '19 May '19 Jun '19 Jul '19 Aug '19
Step by Step Solution
There are 3 Steps involved in it

Get step-by-step solutions from verified subject matter experts