

Question: 1 Suppose the null hypothesis is not rejected. State the conclusion based on the results of the test. Three years ago, the mean price of
1
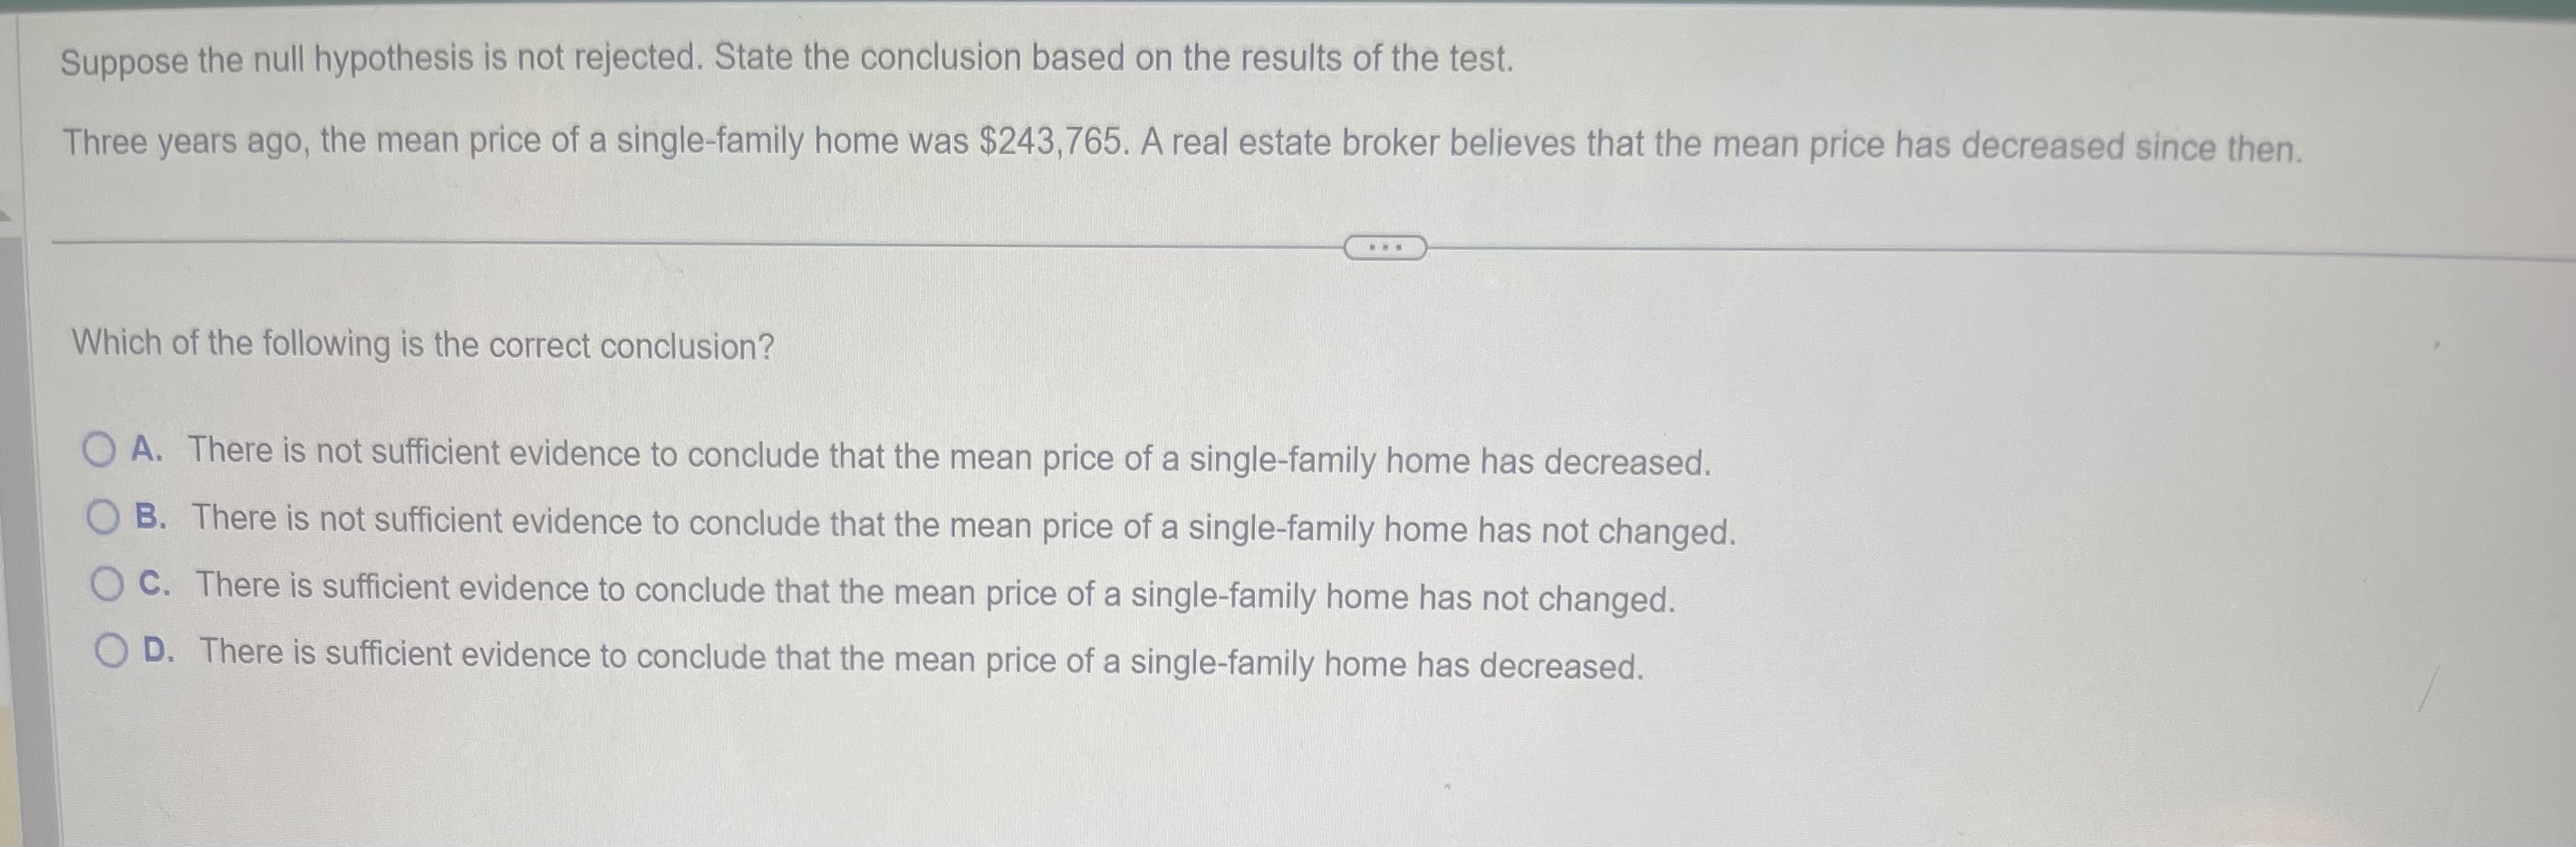
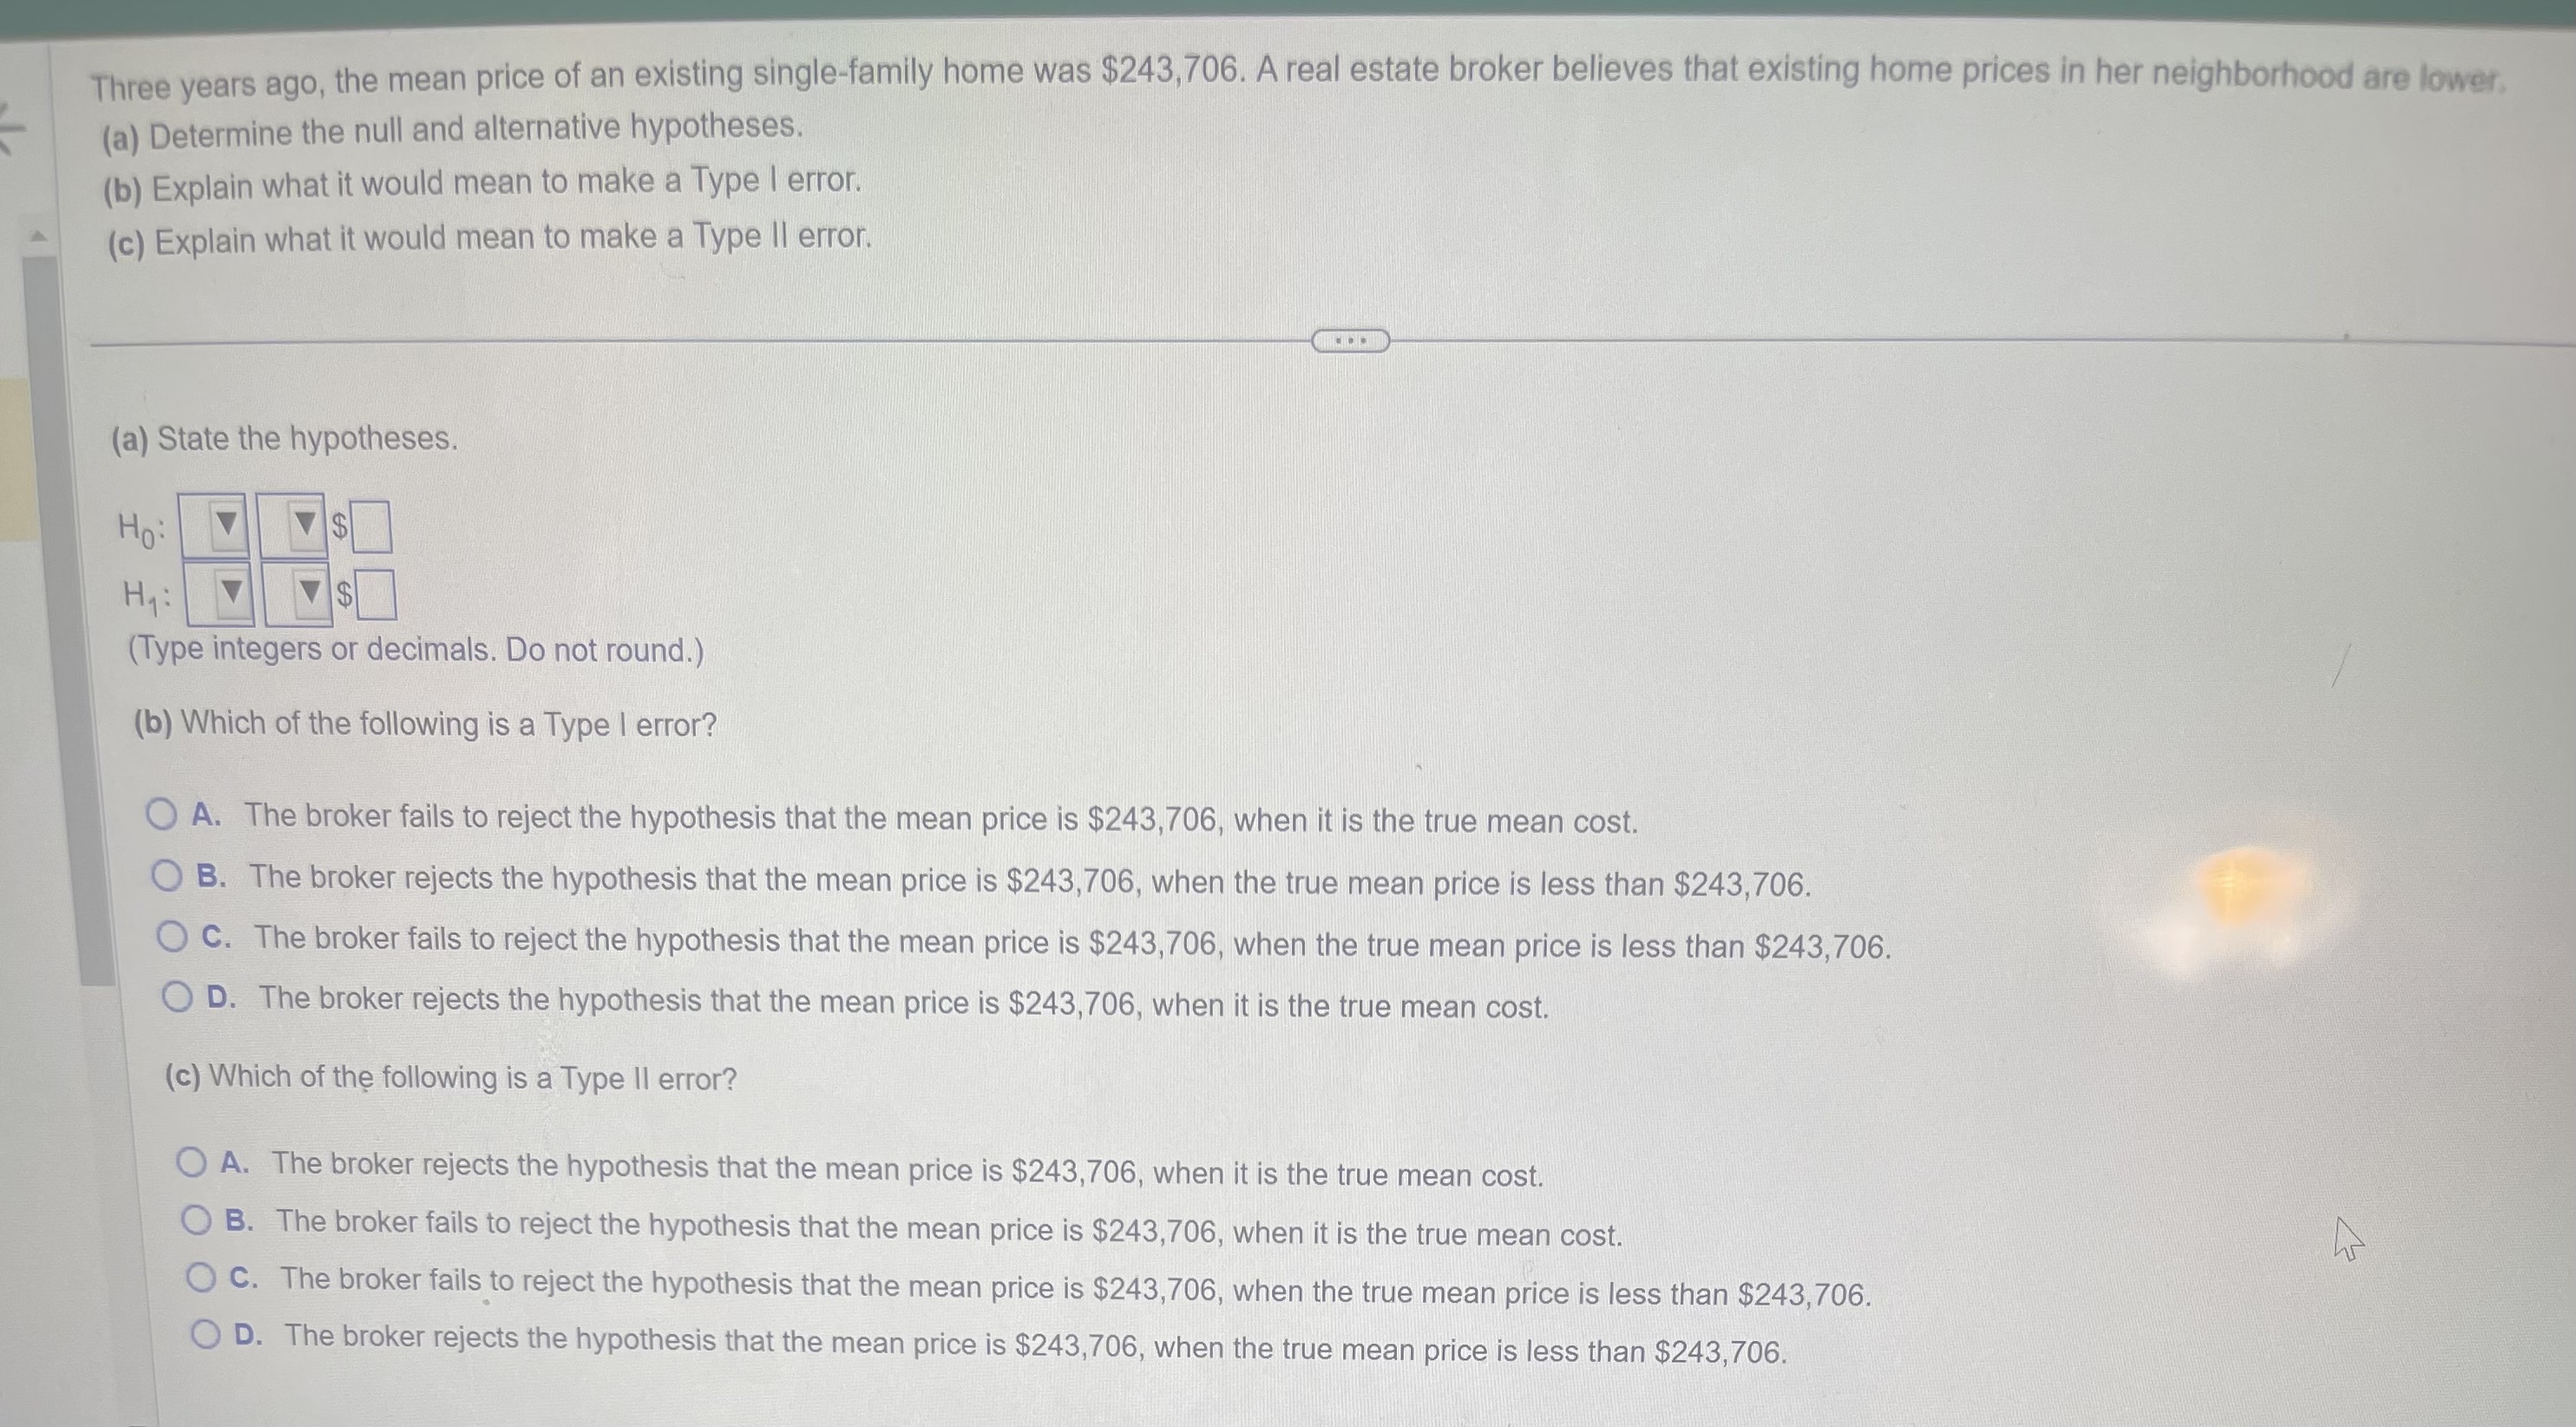


Suppose the null hypothesis is not rejected. State the conclusion based on the results of the test. Three years ago, the mean price of a single-family home was $243,765. A real estate broker believes that the mean price has decreased since then. Which of the following is the correct conclusion? O A. There is not sufficient evidence to conclude that the mean price of a single-family home has decreased. O B. There is not sufficient evidence to conclude that the mean price of a single-family home has not changed. O C. There is sufficient evidence to conclude that the mean price of a single-family home has not changed. O D. There is sufficient evidence to conclude that the mean price of a single-family home has decreased.Three years ago, the mean price of an existing single-family home was $243,706. A real estate broker believes that existing home prices in her neighborhood are lower. (a) Determine the null and alternative hypotheses. (b) Explain what it would mean to make a Type | error. (c) Explain what it would mean to make a Type II error. (a) State the hypotheses. Ho: $ Hy : $ (Type integers or decimals. Do not round.) (b) Which of the following is a Type | error? O A. The broker fails to reject the hypothesis that the mean price is $243,706, when it is the true mean cost. O B. The broker rejects the hypothesis that the mean price is $243,706, when the true mean price is less than $243,706. O C. The broker fails to reject the hypothesis that the mean price is $243,706, when the true mean price is less than $243,706. O D. The broker rejects the hypothesis that the mean price is $243,706, when it is the true mean cost. (c) Which of the following is a Type II error? O A. The broker rejects the hypothesis that the mean price is $243,706, when it is the true mean cost. O B. The broker fails to reject the hypothesis that the mean price is $243,706, when it is the true mean cost. O C. The broker fails to reject the hypothesis that the mean price is $243,706, when the true mean price is less than $243,706. O D. The broker rejects the hypothesis that the mean price is $243,706, when the true mean price is less than $243, 706.A credit score is used by credit agencies (such as mortgage companies and banks) to assess the creditworthiness of individuals. Values range from 300 to 850, with a credit score K over 700 considered to be a quality credit risk. According to a survey, the mean credit score is 706.1. A credit analyst wondered whether high-income individuals (incomes in excess of $100,000 per year) had higher credit scores. He obtained a random sample of 30 high-income individuals and found the sample mean credit score to be 722.1 with a standard deviation of 82.4. Conduct the appropriate test to determine if high-income individuals have higher credit scores at the a = 0.05 level of significance. HO:1 = 706.1 Hy : 1 > 706.1 (Type integers or decimals. Do not round.) Identify the t-statistic. to = 1.064 (Round to two decimal places as needed.) Identify the P-value. P-value = 0.148 (Round to three decimal places as needed.) Make a conclusion regarding the hypothesis. the null hypothesis. There is sufficient evidence to claim that the mean credit score of high-income individuals is * *
Step by Step Solution
There are 3 Steps involved in it

Get step-by-step solutions from verified subject matter experts