

Question: 1 Task Write a program to do console-based plotting of curves/lines in quadrants I and II, but sideways. Write four functions, named (exactly): plotxSquaredPlus2, plotAbsXTimes3,
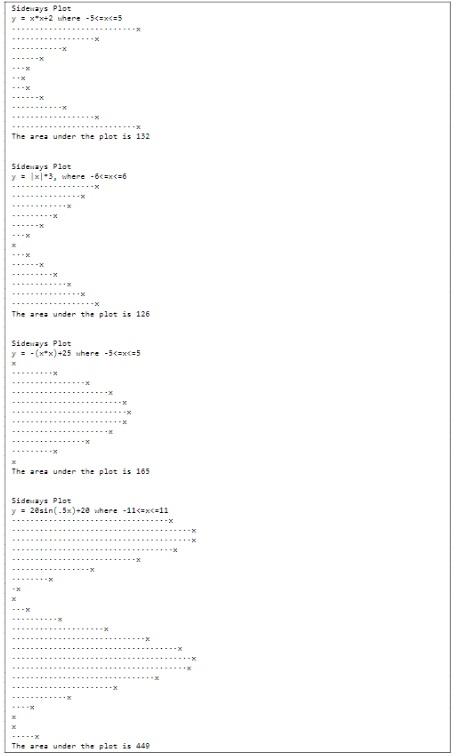
1 Task Write a program to do console-based plotting of curves/lines in quadrants I and II, but sideways. Write four functions, named (exactly): plotxSquaredPlus2, plotAbsXTimes3, plotNegxSquaredPlus25, plotSinWave, and main. The main method should call the others and feed them hardcoded data (since we have not yet covered user input). Each function should accept two integer parameters indicating the minimum and maximum X value to be plotted. The functions should have no return values. Create class-level constants for things we might wish to change later, e.g., a char called PLOT_CHAR that holds an "x" (per samples below), another char called FILL_CHAR that holds an unobtrusive character like ASCII 183, generated with a cast, e... (char)183. 2 Output When functions are called with indicated X values, output should be as shown on the next page. In the functions, construct subtitles using passed-in data; do not hardcode ranges (we might change them later). The area under the plot is estimated by summing the y values, this is a rudimentary Riemann sum (more later). 3 Code Implementation Create a class called Sideplot with all functions within that class. Follow the Course Style Guide (always). 3.1 Call Hierarchy Create the following public static functions. Use this exact call hierarchy (i.e., second-tier functions must not call each other that would be chaining, and we never want that): main plotx Squared Plus 2 plotAbsX Times plotNegXSquared Plus25 plotsin Wave 3.2 What You May Use Constants (at class level), using the requested naming convention (see the Course Style Guide) Variables (but not class-level ones), using requested naming convention (camelCasing) Assignment and calculations Definite loops (for); note that each graph should require no more than two for statements Console output Additional helper functions to reduce redundancy 3.3 What You May Not Use Indefinite loops (while); they are not helpful or indicated here, anyway Selection control structures (if) unless you are doing the extra credit Arrays, lists, or other data structures, objects, libraries, or methods we have not covered . . Sideways Plot y = x2 where -5(Exces The area under the plot is 132 Sideways Plot y = x3, where -6
Step by Step Solution
There are 3 Steps involved in it

Get step-by-step solutions from verified subject matter experts