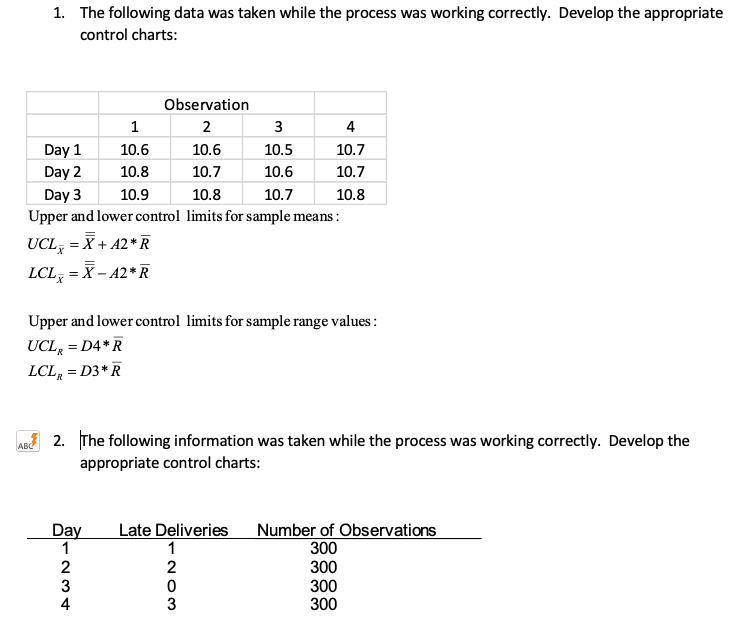
Question: 1. The following data was taken while the process was working correctly. Develop the appropriate control charts: Observation 1 2 3 4 Day 1 10.6

1. The following data was taken while the process

1. The following data was taken while the process was working correctly. Develop the appropriate control charts: Observation 1 2 3 4 Day 1 10.6 10.6 10.5 10.7 Day 2 10.8 10.7 10.6 10.7 Day 3 10.9 10.8 10.7 10.8 Upper and lower control limits for sample means: UCL; = { + A2* = 42* LCL Upper and lower control limits for sample range values: =D4*R LCLR = D3*R UCLK 2. The following information was taken while the process was working correctly. Develop the appropriate control charts: Day 1 Late Deliveries 1 2 WN WON Number of Observations 300 300 300 300 4

Step by Step Solution

There are 3 Steps involved in it

1 Expert Approved Answer
Step: 1 Unlock blur-text-image
Question Has Been Solved by an Expert!

Get step-by-step solutions from verified subject matter experts

Step: 2 Unlock
Step: 3 Unlock

Students Have Also Explored These Related General Management Questions!