

Question: 1. The graph below describes a ____. 16 14 12 10 8 6 4 2 0 O 5 10 15 20

1. The graph below describes a ____.
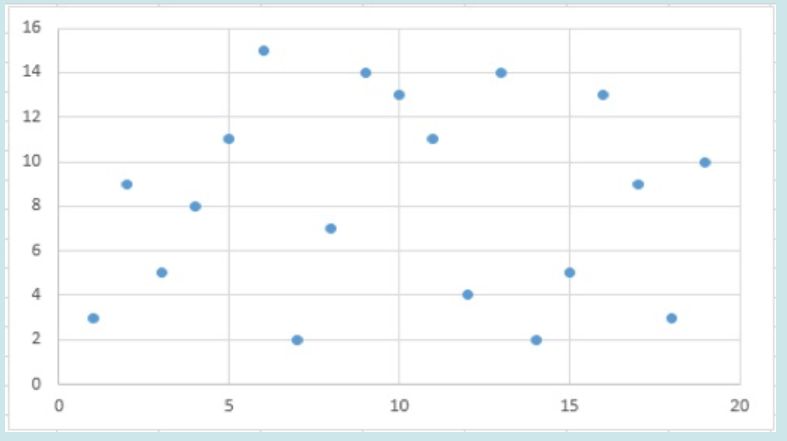
16 14 12 10 8 6 4 2 0 O 5 10 15 20
Step by Step Solution
There are 3 Steps involved in it
1 Expert Approved Answer
Step: 1 Unlock

Question Has Been Solved by an Expert!
Get step-by-step solutions from verified subject matter experts
Step: 2 Unlock
Step: 3 Unlock