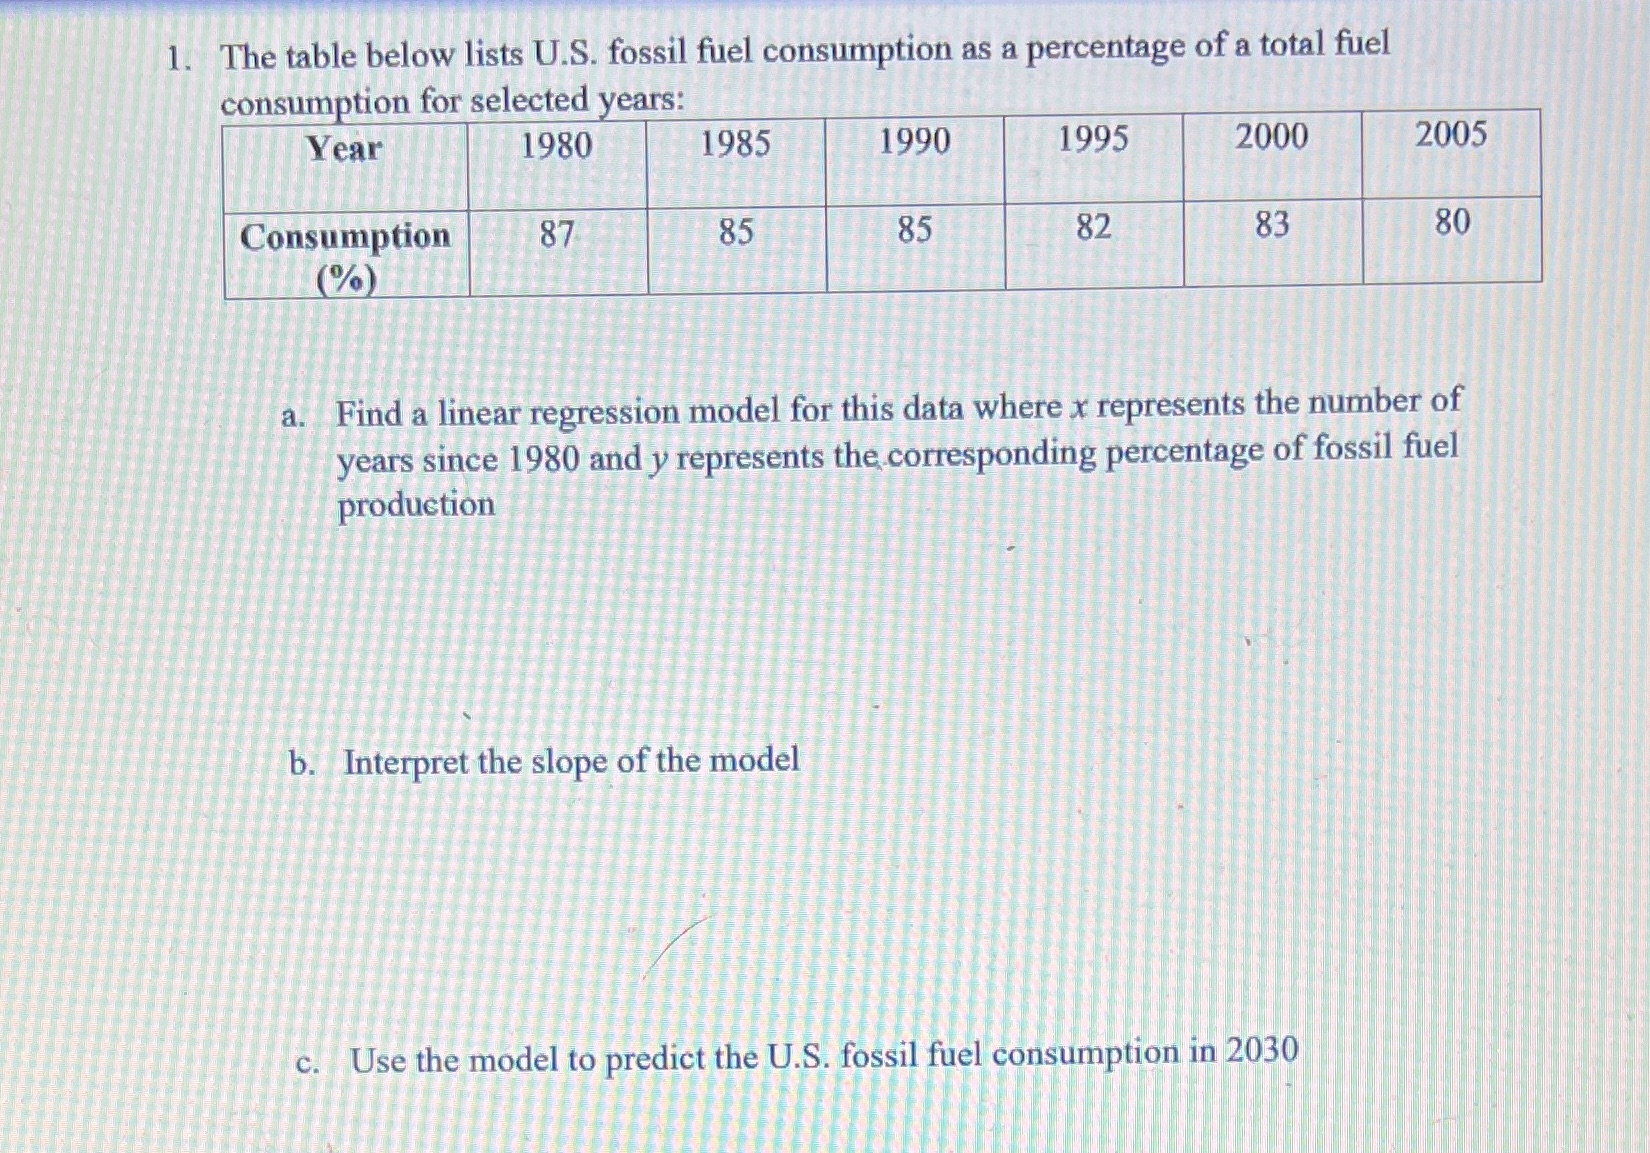
Question: 1. The table below lists U.S. fossil fuel consumption as a percentage of a total fuel consumption for selected years: Year 1980 1985 1990 1995

1. The table below lists U.S. fossil fuel
1. The table below lists U.S. fossil fuel consumption as a percentage of a total fuel consumption for selected years: Year 1980 1985 1990 1995 2000 2005 Consumption 87 85 85 82 83 80 (%) a. Find a linear regression model for this data where x represents the number of years since 1980 and y represents the corresponding percentage of fossil fuel production b. Interpret the slope of the model c. Use the model to predict the U.S. fossil fuel consumption in 2030

Step by Step Solution

There are 3 Steps involved in it

1 Expert Approved Answer
Step: 1 Unlock blur-text-image
Question Has Been Solved by an Expert!

Get step-by-step solutions from verified subject matter experts

Step: 2 Unlock
Step: 3 Unlock

Students Have Also Explored These Related Mathematics Questions!