

Question: The table below lists U.S. fossil fuel consumption as a percentage of a total fuel consumption for selected years: Year 1980 1985 1990 1995
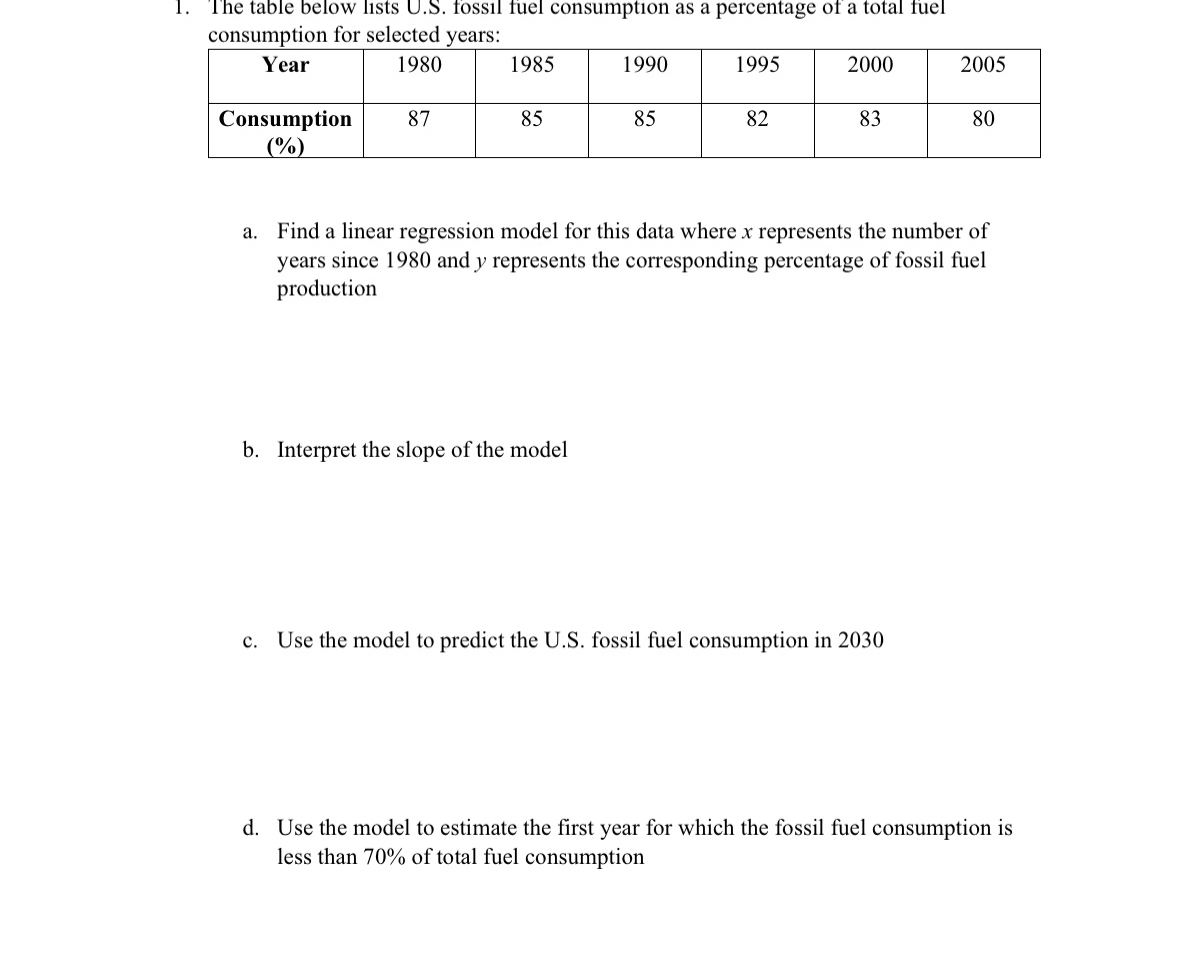
The table below lists U.S. fossil fuel consumption as a percentage of a total fuel consumption for selected years: Year 1980 1985 1990 1995 2000 2005 Consumption (%) 87 85 85 82 83 80 a. Find a linear regression model for this data where x represents the number of years since 1980 and y represents the corresponding percentage of fossil fuel production b. Interpret the slope of the model c. Use the model to predict the U.S. fossil fuel consumption in 2030 d. Use the model to estimate the first year for which the fossil fuel consumption is less than 70% of total fuel consumption
Step by Step Solution
3.25 Rating (143 Votes )
There are 3 Steps involved in it
a To find a linear regression model for the data we need to calculate the slope and intercept of the ... View full answer

Get step-by-step solutions from verified subject matter experts