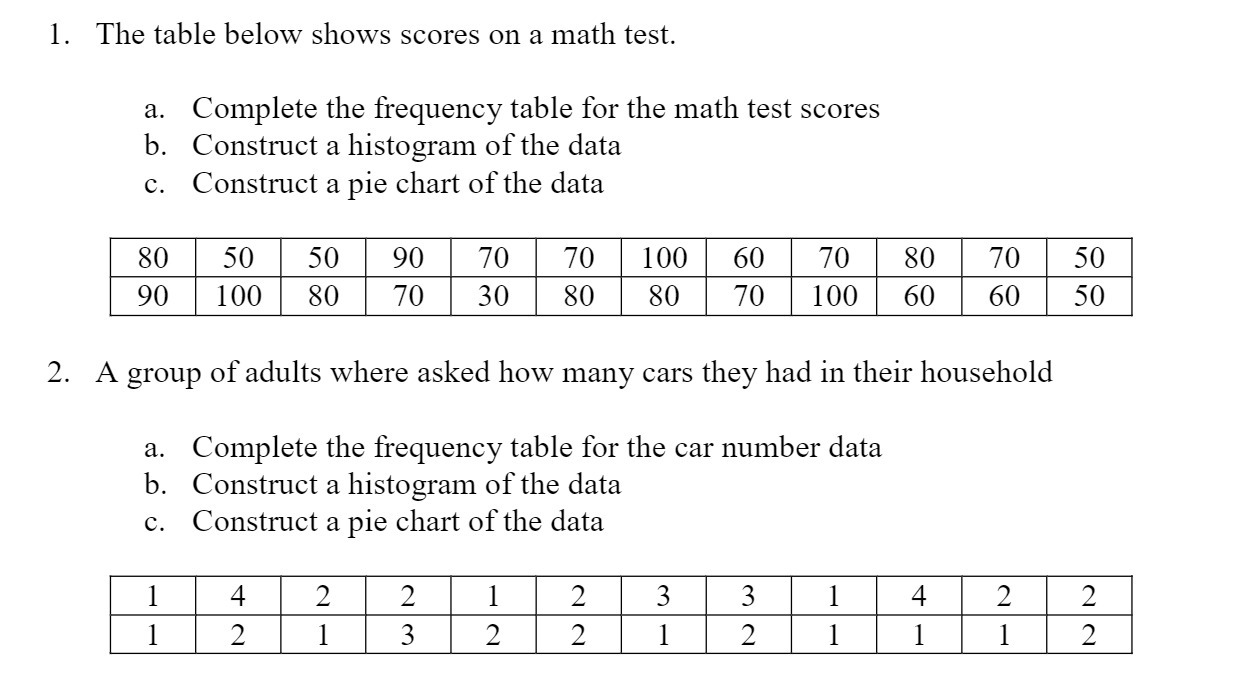
Question: 1. The table below shows scores on a math test. a. Complete the frequency table for the math test scores b. Construct a histogram of

1. The table below shows scores on a math test.
1. The table below shows scores on a math test. a. Complete the frequency table for the math test scores b. Construct a histogram of the data c. Construct a pie chart of the data mun-mm 90 30 80 80 70 60 50 100 80 70 100 60 2. A group of adults where asked how many cars they had in their household a. Complete the frequency table for the car number data b. Construct a histogram of the data c. Construct a pie chart of the data

Step by Step Solution

There are 3 Steps involved in it

1 Expert Approved Answer
Step: 1 Unlock blur-text-image
Question Has Been Solved by an Expert!

Get step-by-step solutions from verified subject matter experts

Step: 2 Unlock
Step: 3 Unlock

Students Have Also Explored These Related Mathematics Questions!