

Question: 1. The UCL for an R-chart is 46.5575 for samples of size 13 each taken hourly for 21 hours. What is the mean of the
1.
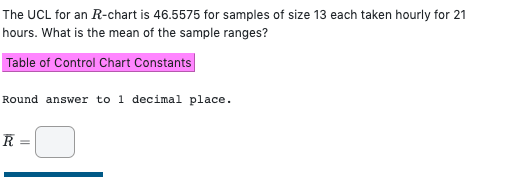
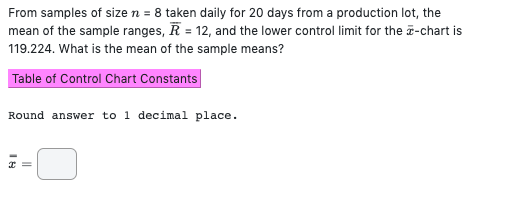
The UCL for an R-chart is 46.5575 for samples of size 13 each taken hourly for 21 hours. What is the mean of the sample ranges? Table of Control Chart Constants Round answer to 1 decimal place. RFrom samples of size n = 8 taken daily for 20 days from a production lot, the mean of the sample ranges, R = 12, and the lower control limit for the -chart is 119.224. What is the mean of the sample means? Table of Control Chart Constants Round answer to 1 decimal place
Step by Step Solution
There are 3 Steps involved in it
1 Expert Approved Answer
Step: 1 Unlock

Question Has Been Solved by an Expert!
Get step-by-step solutions from verified subject matter experts
Step: 2 Unlock
Step: 3 Unlock