

Question: 1. The worksheet labeled Demand_1 in the Case Study Two Data document provides information about the initial demand curve faced by the monopolist. This monopolist
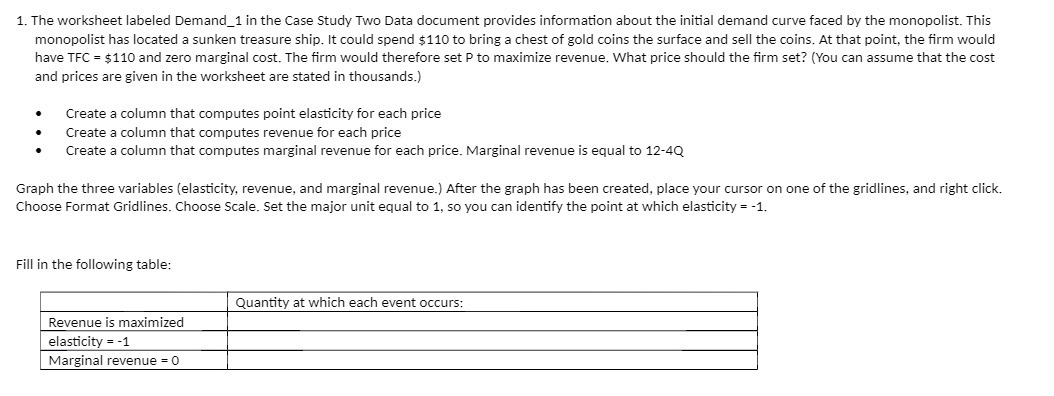
1. The worksheet labeled Demand_1 in the Case Study Two Data document provides information about the initial demand curve faced by the monopolist. This monopolist has located a sunken treasure ship. rt could spend $110to bring a chest of gold coins the surface and sell the coins. At that point. the rm would have TFC = $110 and zero marginal cost. The rm would therefore set P to maximize revenue. What price should the rm set? {You can assume that the cost and prices are given in the worksheet are stated in thousands.) o Create a column that computes point elasticity for each price 0 Create a column that computes revenue for each price 0 Create a column that computes marginal revenue for each price. Marginal revenue is equal to 12-4Q Graph the iree variables (elasticity, revenue, and marginal revenue.) After The graph has been created, place your cursor on one of the gridlines, and right click. Choose Format Gridlines. Choose Scale. Set the major unit equal to 1, so you can identify the point at which elasticity = 1. Fill in the following table: Quantity at which each event occurs: Revenue is maximized elasticity = -1 Marginal revenue = D
Step by Step Solution
There are 3 Steps involved in it

Get step-by-step solutions from verified subject matter experts