

Question: 1. UPPER CONTROL LIMIT X-BAR 2. LOWER CONTROL LIMIT X-BAR 3. IS IT IN OR OUT OF CONTROL? 4. UPPER CONTROL LIMIT R-BAR 5. LOWER
 1. UPPER CONTROL LIMIT X-BAR
2. LOWER CONTROL LIMIT X-BAR
3. IS IT IN OR OUT OF CONTROL?
4. UPPER CONTROL LIMIT R-BAR
5. LOWER CONTROL LIMIT R-BAR
6. IS IT IN OR OUT OF CONTROL?
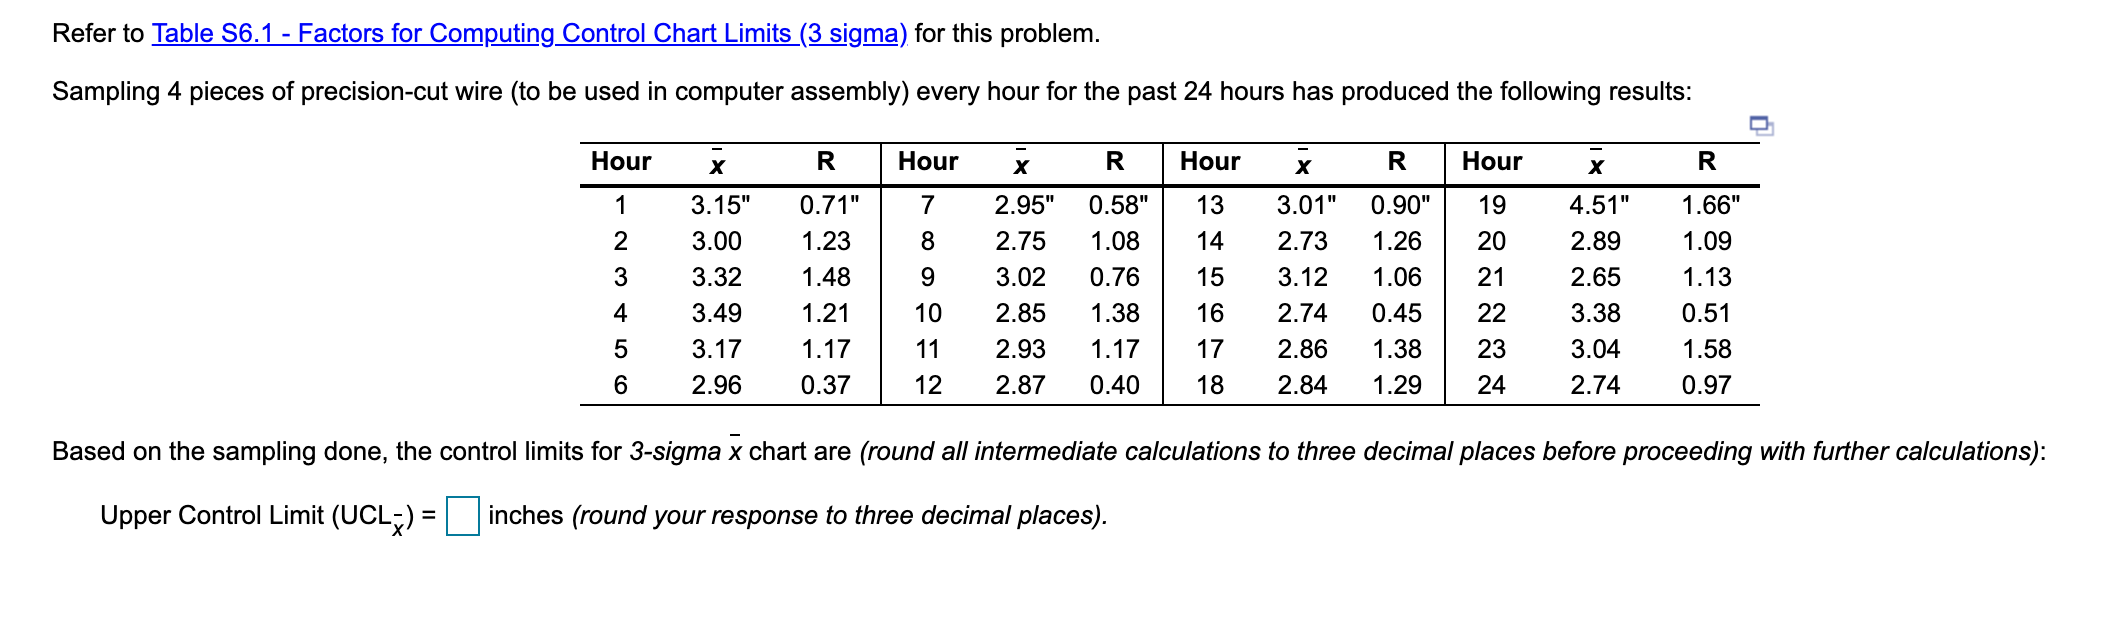
Refer to Table 56.1 - Factors for Computing Control Chart Limits (3 sigma) for this problem. Sampling 4 pieces of precision-cut wire (to be used in computer assembly) every hour for the past 24 hours has produced the following results: Hour R Hour R Hour R Hour R 7 13 19 8 9 1 2 3 4 5 6 3.15" 3.00 3.32 3.49 3.17 2.96 0.71" 1.23 1.48 1.21 1.17 0.37 2.95" 2.75 3.02 2.85 2.93 2.87 0.58" 1.08 0.76 1.38 1.17 0.40 3.01" 2.73 3.12 2.74 2.86 2.84 14 15 16 17 18 0.90" 1.26 1.06 0.45 1.38 1.29 4.51" 2.89 2.65 3.38 3.04 2.74 20 21 22 23 24 10 11 12 1.66" 1.09 1.13 0.51 1.58 0.97 Based on the sampling done, the control limits for 3-sigma x chart are (round all intermediate calculations to three decimal places before proceeding with further calculations): Upper Control Limit (UCLZ) = inches (round your response to three decimal places)Step by Step Solution
There are 3 Steps involved in it
1 Expert Approved Answer
Step: 1 Unlock

Question Has Been Solved by an Expert!
Get step-by-step solutions from verified subject matter experts
Step: 2 Unlock
Step: 3 Unlock