

Question: 1) Use an Excel bar chart to show your data. 2) Assume that the data given in the table of the problem is last year,
1) Use an Excel bar chart to show your data.
2) Assume that the data given in the table of the problem is last year, then changes in this year are given in the problem. Bottom line is to calculate Earnings per Share (use =formulas) for this year.
This is last year, then changes in this year are given in the problem. Bottom line is to calculate Earnings per Share (use =formulas) for this year.
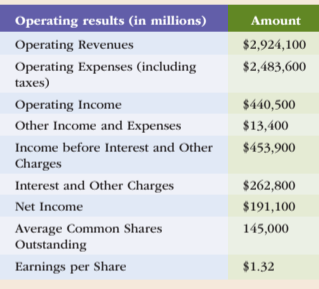
Operating results (in millions) Operating Revenues Operating Expenses (including taxes) Operating Income Other Income and Expenses Income before Interest and Other Charges Interest and Other Charges Net Income Average Common Shares Outstanding Earnings per Share Amount $2,924,100 $2,483,600 $440,500 $13,400 $453,900 $262,800 $191,100 145,000 $1.32 Operating results (in millions) Operating Revenues Operating Expenses (including taxes) Operating Income Other Income and Expenses Income before Interest and Other Charges Interest and Other Charges Net Income Average Common Shares Outstanding Earnings per Share Amount $2,924,100 $2,483,600 $440,500 $13,400 $453,900 $262,800 $191,100 145,000 $1.32
Step by Step Solution
There are 3 Steps involved in it

Get step-by-step solutions from verified subject matter experts