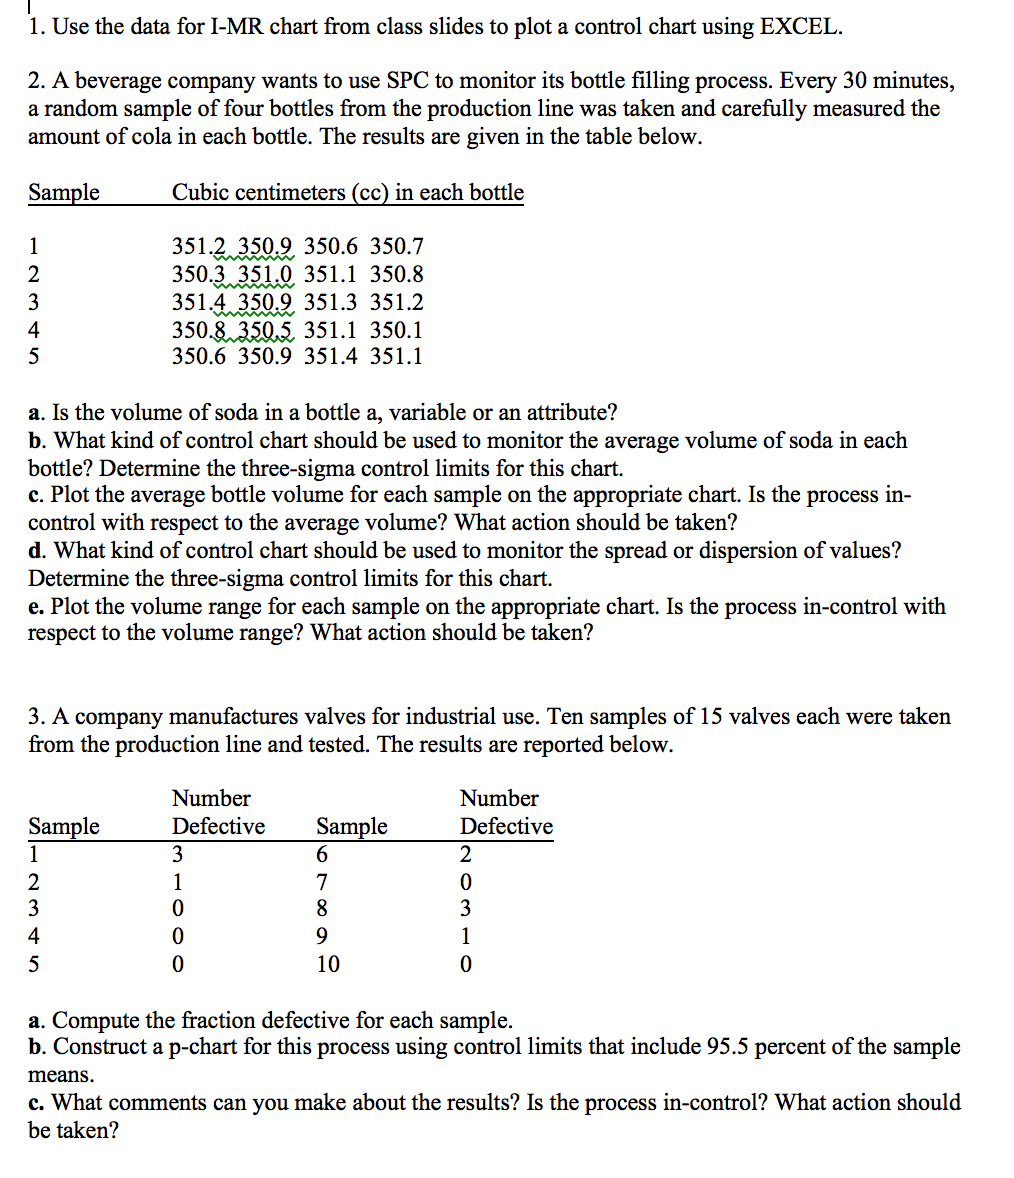
Question: 1. Use the data for I-MR chart from class slides to plot a control chart using EXCEL. 2. A beverage company wants to use SPC

1. Use the data for I-MR chart from class slides

1. Use the data for I-MR chart from class slides to plot a control chart using EXCEL. 2. A beverage company wants to use SPC to monitor its bottle filling process. Every 30 minutes, a random sample of four bottles from the production line was taken and carefully measured the amount of cola in each bottle. The results are given in the table below. Sample Cubic centimeters (cc) in each bottle 1 2 3 4 5 351.2.350:9 350.6 350.7 350.3.351.0 351.1 350.8 351.4.350.9 351.3 351.2 350.8.350.5, 351.1 350.1 350.6 350.9 351.4 351.1 a. Is the volume of soda in a bottle a, variable or an attribute? b. What kind of control chart should be used to monitor the average volume of soda in each bottle? Determine the three-sigma control limits for this chart. c. Plot the average bottle volume for each sample on the appropriate chart. Is the process in- control with respect to the average volume? What action should be taken? d. What kind of control chart should be used to monitor the spread or dispersion of values? Determine the three-sigma control limits for this chart. e. Plot the volume range for each sample on the appropriate chart. Is the process in-control with respect to the volume range? What action should be taken? 3. A company manufactures valves for industrial use. Ten samples of 15 valves each were taken from the production line and tested. The results are reported below. Sample 1 2 3 4 5 Number Defective 3 1 0 0 0 Sample 6 7 8 9 10 Number Defective 2 0 3 1 0 a. Compute the fraction defective for each sample. b. Construct a p-chart for this process using control limits that include 95.5 percent of the sample means. c. What comments can you make about the results? Is the process in-control? What action should be taken? 1. Use the data for I-MR chart from class slides to plot a control chart using EXCEL. 2. A beverage company wants to use SPC to monitor its bottle filling process. Every 30 minutes, a random sample of four bottles from the production line was taken and carefully measured the amount of cola in each bottle. The results are given in the table below. Sample Cubic centimeters (cc) in each bottle 1 2 3 4 5 351.2.350:9 350.6 350.7 350.3.351.0 351.1 350.8 351.4.350.9 351.3 351.2 350.8.350.5, 351.1 350.1 350.6 350.9 351.4 351.1 a. Is the volume of soda in a bottle a, variable or an attribute? b. What kind of control chart should be used to monitor the average volume of soda in each bottle? Determine the three-sigma control limits for this chart. c. Plot the average bottle volume for each sample on the appropriate chart. Is the process in- control with respect to the average volume? What action should be taken? d. What kind of control chart should be used to monitor the spread or dispersion of values? Determine the three-sigma control limits for this chart. e. Plot the volume range for each sample on the appropriate chart. Is the process in-control with respect to the volume range? What action should be taken? 3. A company manufactures valves for industrial use. Ten samples of 15 valves each were taken from the production line and tested. The results are reported below. Sample 1 2 3 4 5 Number Defective 3 1 0 0 0 Sample 6 7 8 9 10 Number Defective 2 0 3 1 0 a. Compute the fraction defective for each sample. b. Construct a p-chart for this process using control limits that include 95.5 percent of the sample means. c. What comments can you make about the results? Is the process in-control? What action should be taken

Step by Step Solution

There are 3 Steps involved in it

1 Expert Approved Answer
Step: 1 Unlock blur-text-image
Question Has Been Solved by an Expert!

Get step-by-step solutions from verified subject matter experts

Step: 2 Unlock
Step: 3 Unlock

Students Have Also Explored These Related General Management Questions!