

Question: 1. Use the information below to answer the next 9 questions. A quality inspector took six samples, each with twenty observations, of the weight of
1.
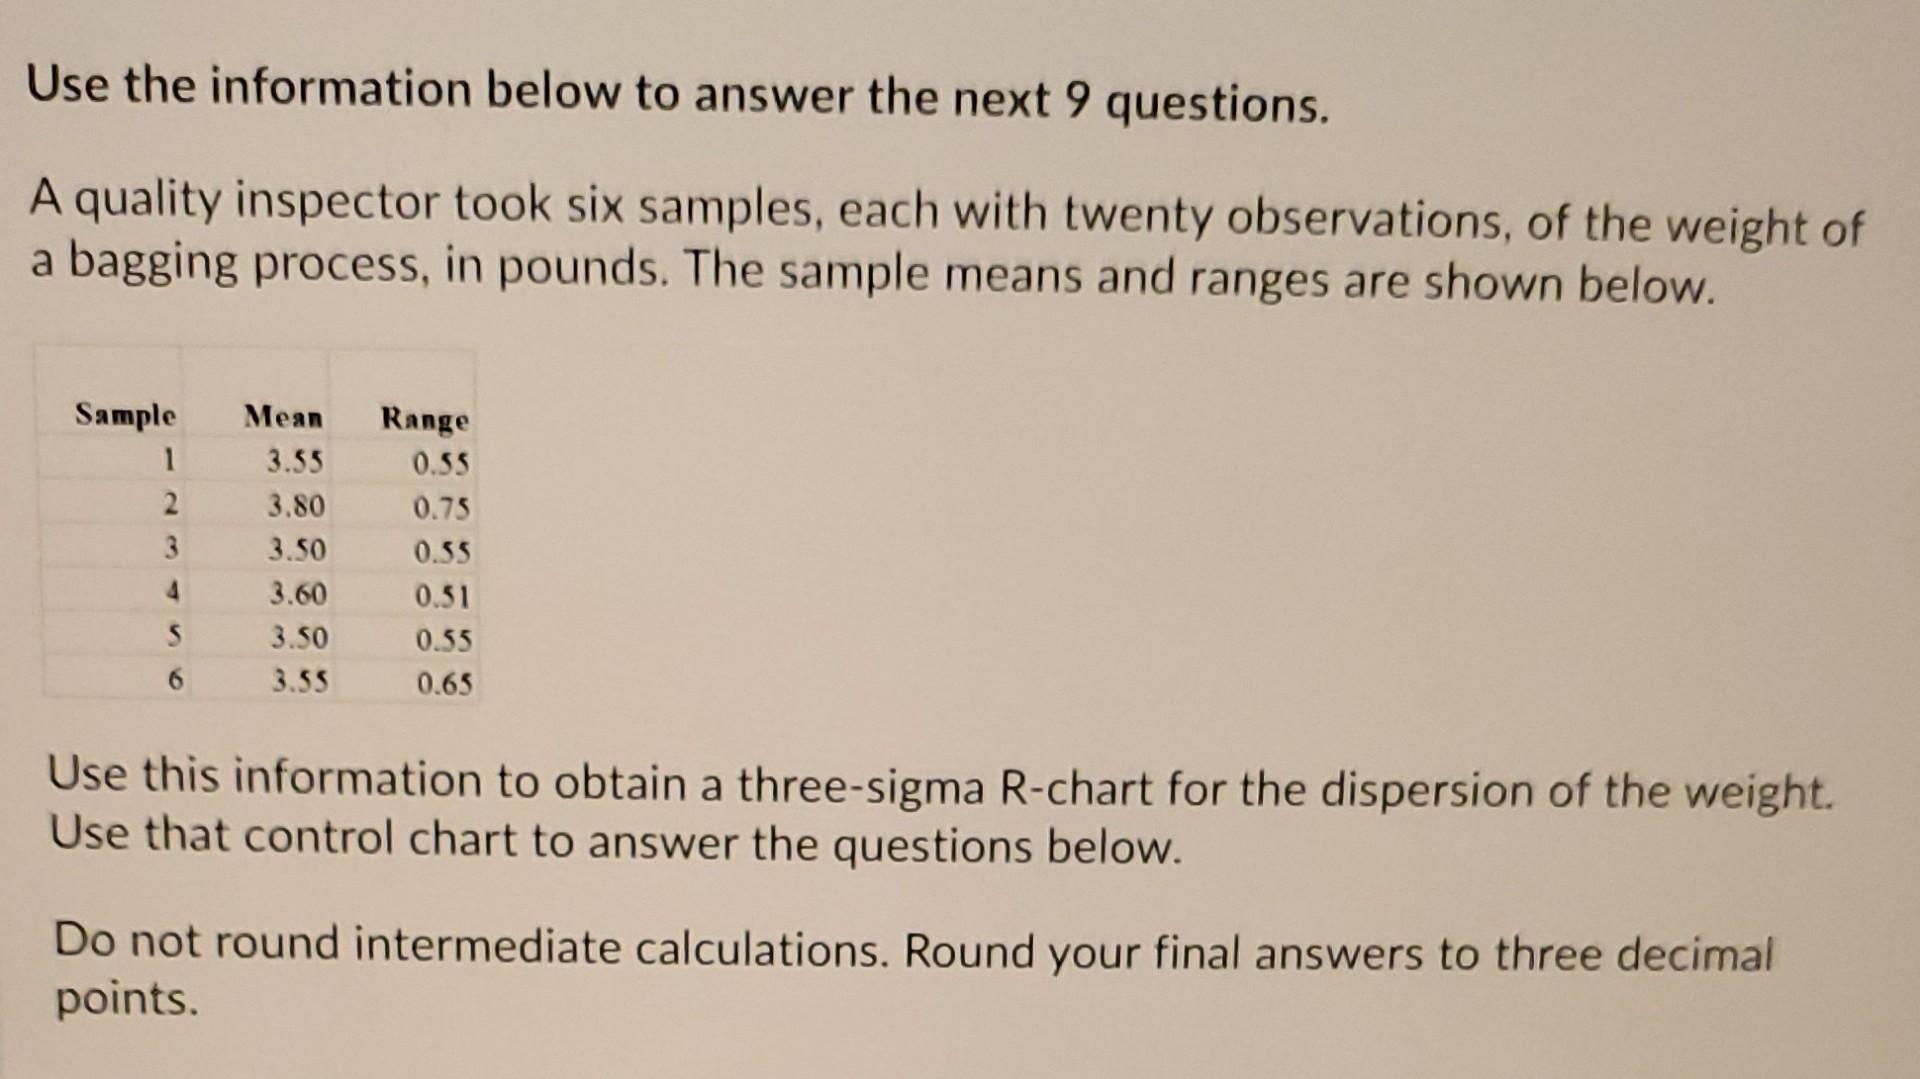
Use the information below to answer the next 9 questions. A quality inspector took six samples, each with twenty observations, of the weight of a bagging process, in pounds. The sample means and ranges are shown below. Sample 1 2 3 4 Mean 3.55 3.80 3.50 3.60 3.50 3.55 Range 0.55 0.75 0.55 0.51 0.55 0.65 S 6 Use this information to obtain a three-sigma R-chart for the dispersion of the weight. Use that control chart to answer the questions below. Do not round intermediate calculations. Round your final answers to three decimal points. What is the upper control limit? Your Answer: Answer What is the center line? Your Answer: Answer What is the lower control limit? Your Answer: Answer Sample 1 is out of control. True O False Sample 2 is out of control. True O False Sample 3 is out of control. True O False Sample 4 is out of control. True False Sample 5 is out of control. True False Sample 6 is out of control. O True False
Step by Step Solution
There are 3 Steps involved in it
1 Expert Approved Answer
Step: 1 Unlock

Question Has Been Solved by an Expert!
Get step-by-step solutions from verified subject matter experts
Step: 2 Unlock
Step: 3 Unlock