

Question: 1. Using Excel 2013, create a spreadsheet using formulas for Marginal Product, Total Revenue, and Marginal Revenue Product (which must be calculated) as shown in
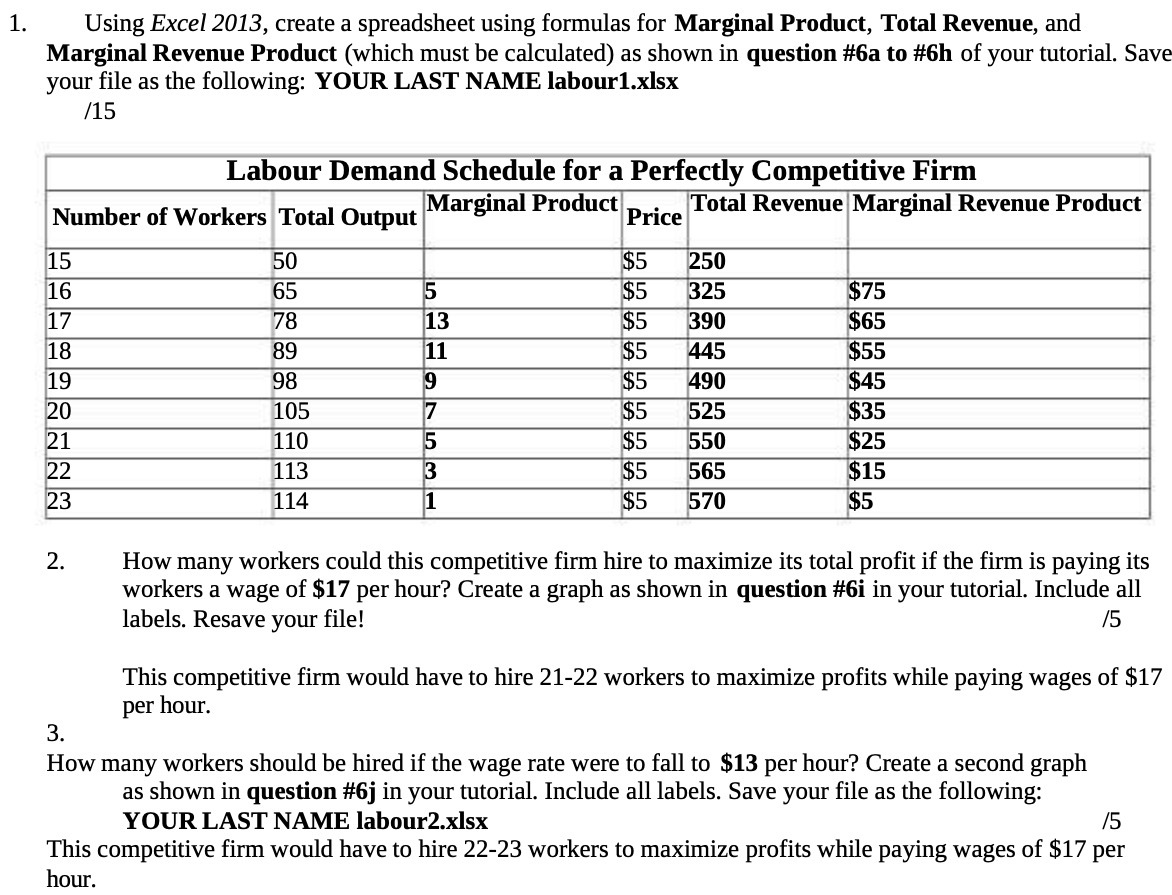
1. Using Excel 2013, create a spreadsheet using formulas for Marginal Product, Total Revenue, and Marginal Revenue Product (which must be calculated) as shown in question #6a to #6h of your tutorial. Save your file as the following: YOUR LAST NAME labour1.xlsx 1'15 Labour Demand Schedule for a Perfectly Competitive Firm Number of Workers Total Output 'Marginal Product Price Total Revenue Marginal Revenue Product ' 15 50 : $5 '250 16 65 {5 $5 '325 $75 17 78 '13 $5 '390 $65 18 89 E11 $5 '445 $55 19 93 \"3 $5 '490 $45 20 105 7 $5 525 $35 21 110 5 $5 550 $25 22 113 :3 $5 '565 $15 23 114 :1 $5 '570 $5 2. How many workers could this competitive firm hire to maximize its total profit if the firm is paying its workers a wage of $17 per hour? Create a graph as shown in question #Gi in your tutorial. Include all labels. Resave your file! /5 This competitive firm would have to hire 21-22 workers to maximize profits while paying wages of $17 per hour. 3. How many workers should be hired if the wage rate were to fall to $13 per hour? Create a second graph as shown in question #Gj in your tutorial. Include all labels. Save your file as the following: YOUR LAST NAME labour2.xlsx f5 This competitive firm would have to hire 2223 workers to maximize profits while paying wages of $17 per hour
Step by Step Solution
There are 3 Steps involved in it

Get step-by-step solutions from verified subject matter experts