

Question: 1. Using R please make a bar graph for the following: a.) Make a bar graph to show the count of groups b.) Make a
1. Using R please make a bar graph for the following:
a.) Make a bar graph to show the count of groups
b.) Make a bar graph to display the mean weight gain for the 3 groups
2.) Obtain the mean and variance for each group separately, and compare them. What conclusions can be made?
(I am trying to upload the excel file, but it seems like Chegg does not allow that so here is a picture of the two columns)
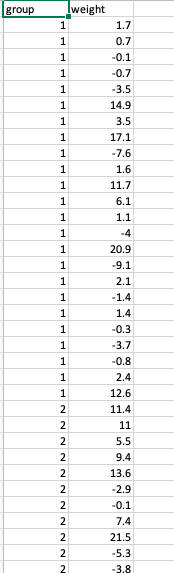
group Iweight 1 1.7 1 0.7 1 -0.1 1 -0.7 1 -3.5 1 14.9 1 3.5 1 17.1 1 -7.6 1 1.6 1 11.7 1 6.1 1 1.1 1 -4 1 20.9 1 -9.1 1 2.1 1 -1.4 1 1.4 1 -0.3 1 -3.7 1 -0.8 1 2.4 1 12.6 2 11.4 2 11 2 5.5 2 9.4 2 13.6 2 -2.9 2 -0.1 2 7.4 2 21.5 2 -5.3 2 -3.8 group Iweight 1 1.7 1 0.7 1 -0.1 1 -0.7 1 -3.5 1 14.9 1 3.5 1 17.1 1 -7.6 1 1.6 1 11.7 1 6.1 1 1.1 1 -4 1 20.9 1 -9.1 1 2.1 1 -1.4 1 1.4 1 -0.3 1 -3.7 1 -0.8 1 2.4 1 12.6 2 11.4 2 11 2 5.5 2 9.4 2 13.6 2 -2.9 2 -0.1 2 7.4 2 21.5 2 -5.3 2 -3.8
Step by Step Solution
There are 3 Steps involved in it

Get step-by-step solutions from verified subject matter experts