

Question: 1. Using the attached data on the VIX and SPY. a) Plot the VIX and annualized GJR-GARCH volatilities to see whether there is a bias.
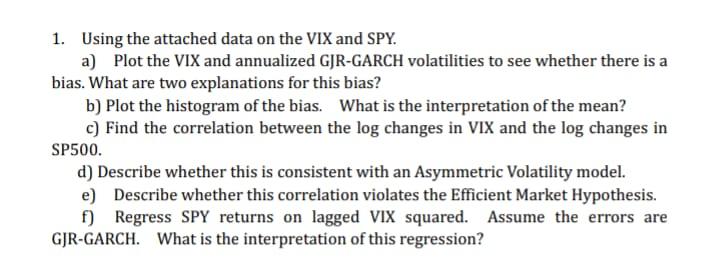
1. Using the attached data on the VIX and SPY. a) Plot the VIX and annualized GJR-GARCH volatilities to see whether there is a bias. What are two explanations for this bias? b) Plot the histogram of the bias. What is the interpretation of the mean? c) Find the correlation between the log changes in VIX and the log changes in SP500. d) Describe whether this is consistent with an Asymmetric Volatility model. e) Describe whether this correlation violates the Efficient Market Hypothesis. f) Regress SPY returns on lagged VIX squared. Assume the errors are GJR-GARCH. What is the interpretation of this regression? 1. Using the attached data on the VIX and SPY. a) Plot the VIX and annualized GJR-GARCH volatilities to see whether there is a bias. What are two explanations for this bias? b) Plot the histogram of the bias. What is the interpretation of the mean? c) Find the correlation between the log changes in VIX and the log changes in SP500. d) Describe whether this is consistent with an Asymmetric Volatility model. e) Describe whether this correlation violates the Efficient Market Hypothesis. f) Regress SPY returns on lagged VIX squared. Assume the errors are GJR-GARCH. What is the interpretation of this regression
Step by Step Solution
There are 3 Steps involved in it

Get step-by-step solutions from verified subject matter experts