

Question: 1. Using the data above, what is the average percentage of infections? 2. Construct (and submit) a Run Chart. What conclusions do you reach? What
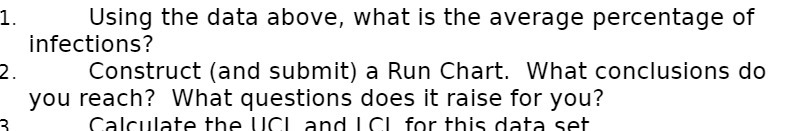
1. Using the data above, what is the average percentage of infections? 2. Construct (and submit) a Run Chart. What conclusions do you reach? What questions does it raise for you? Calculate the UCL and I Cl for this data set
Step by Step Solution
There are 3 Steps involved in it
1 Expert Approved Answer
Step: 1 Unlock

Question Has Been Solved by an Expert!
Get step-by-step solutions from verified subject matter experts
Step: 2 Unlock
Step: 3 Unlock