

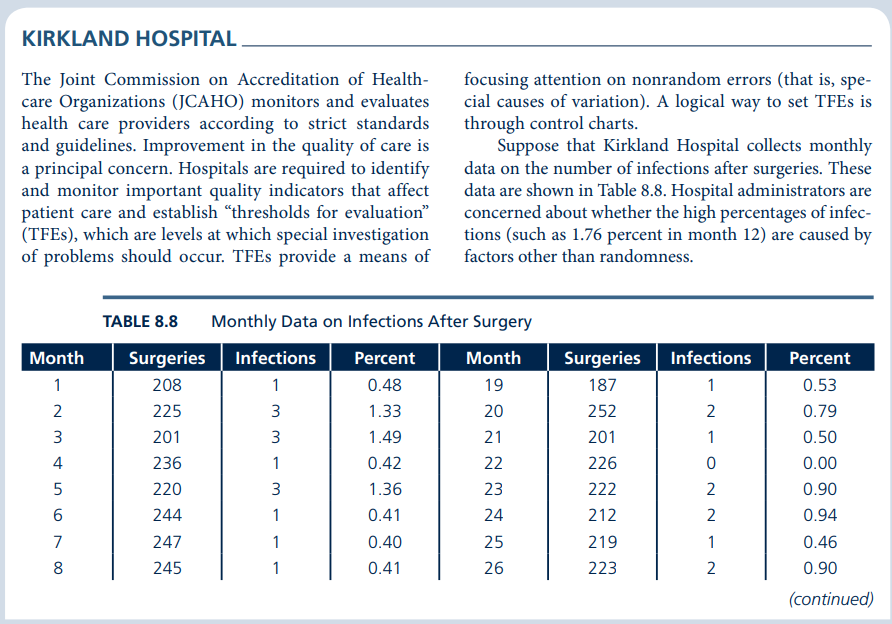
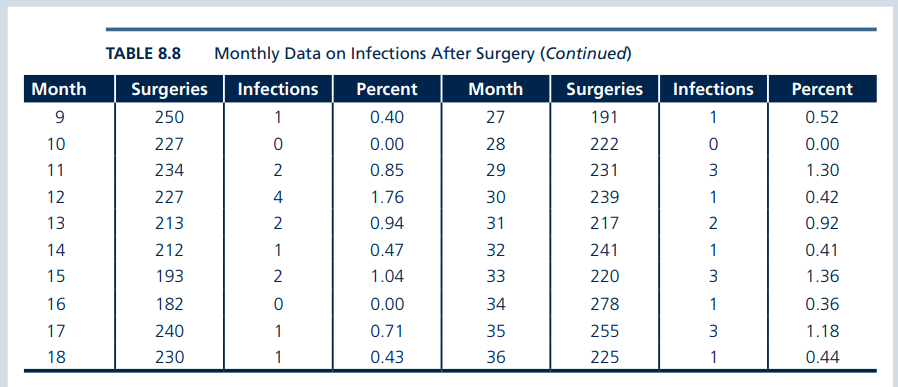
Question: Assignment 1. Using the data in Table 8.8, what is the average percentage of infections? 2. Construct an appropriate control chart, compute the upper and
Assignment
1. Using the data in Table 8.8, what is the average percentage of infections?
2. Construct an appropriate control chart, compute the upper and lower control limits, plot the data on a control chart, and determine if the process is in statistical control. Based on your analysis, what action, if any, should management take?
3. What TFE should management use to monitor future data?
TABLE 8.8 Monthly Data on Infections After Surgery Monthly Data on Infections After Surgery (ContinueaStep by Step Solution
There are 3 Steps involved in it
1 Expert Approved Answer
Step: 1 Unlock

Question Has Been Solved by an Expert!
Get step-by-step solutions from verified subject matter experts
Step: 2 Unlock
Step: 3 Unlock