

Question: 1) Using the data below, a) Determine the center line and control limits for the X and R chart. The sample size is 5 ,
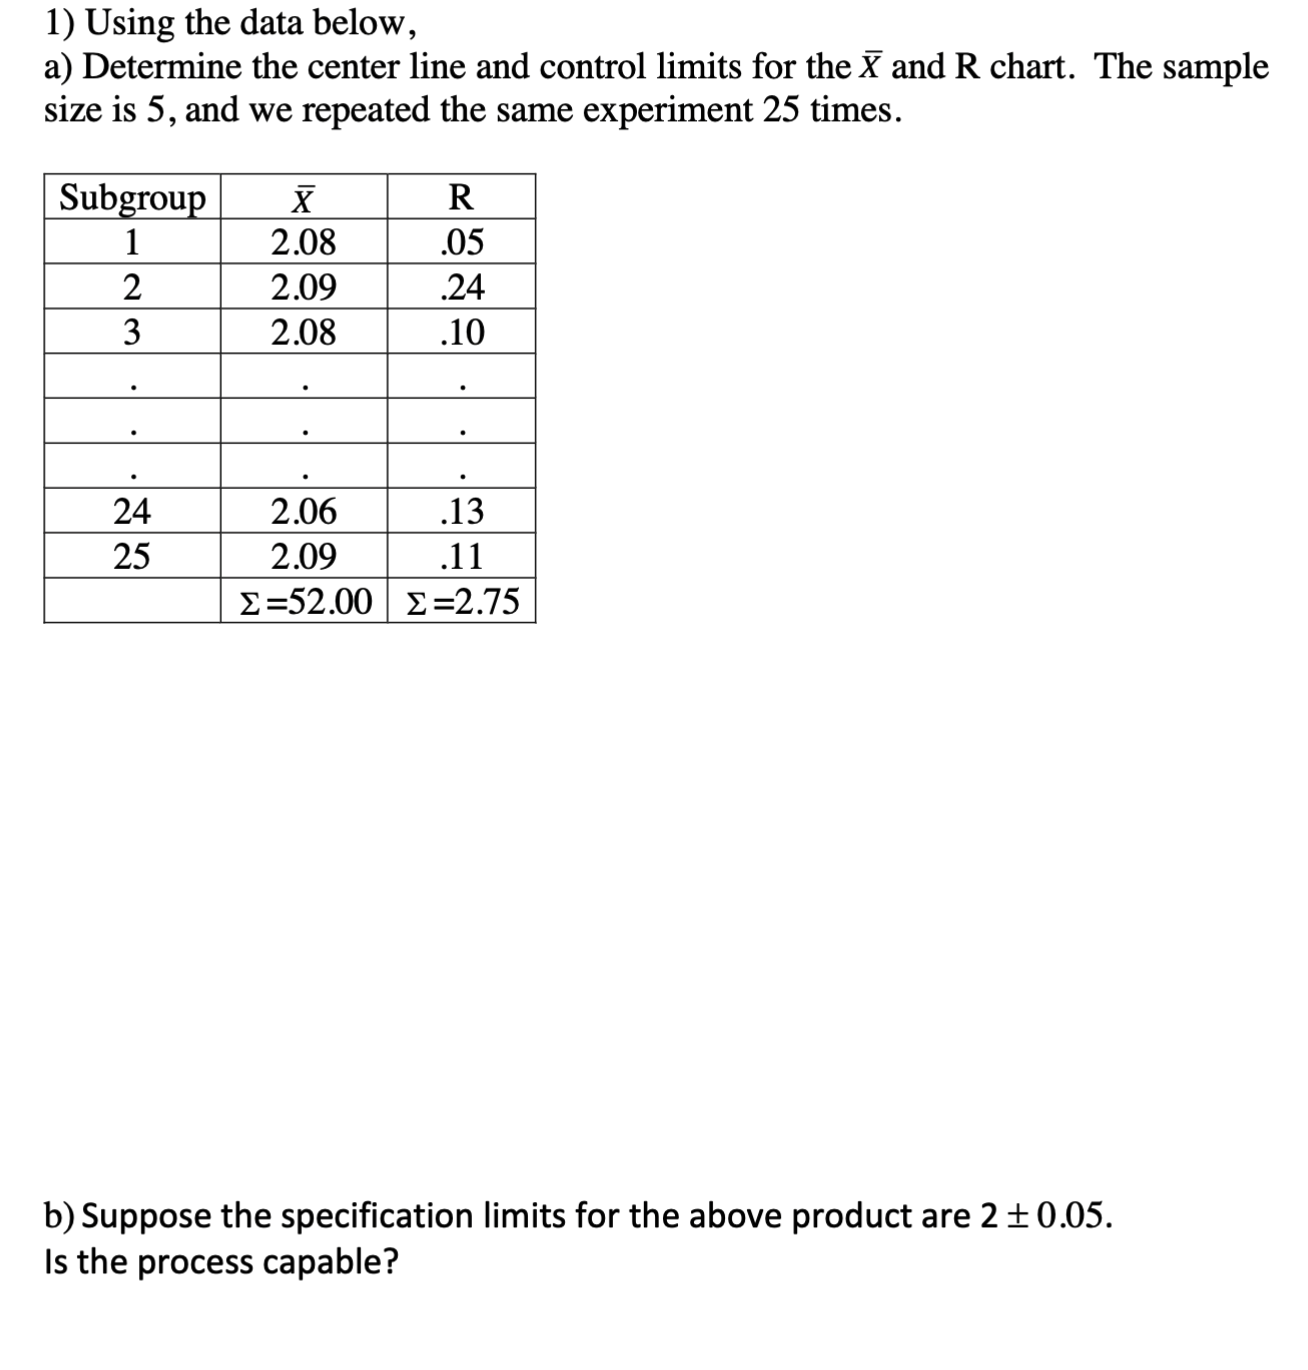
1) Using the data below, a) Determine the center line and control limits for the X and R chart. The sample size is 5 , and we repeated the same experiment 25 times. b) Suppose the specification limits for the above product are 20.05. Is the process capable
Step by Step Solution
There are 3 Steps involved in it
1 Expert Approved Answer
Step: 1 Unlock

Question Has Been Solved by an Expert!
Get step-by-step solutions from verified subject matter experts
Step: 2 Unlock
Step: 3 Unlock