

Question: 1- Using the histograms from your output file, describe the differences in the frequency distributions between the two data sets. For each of the two
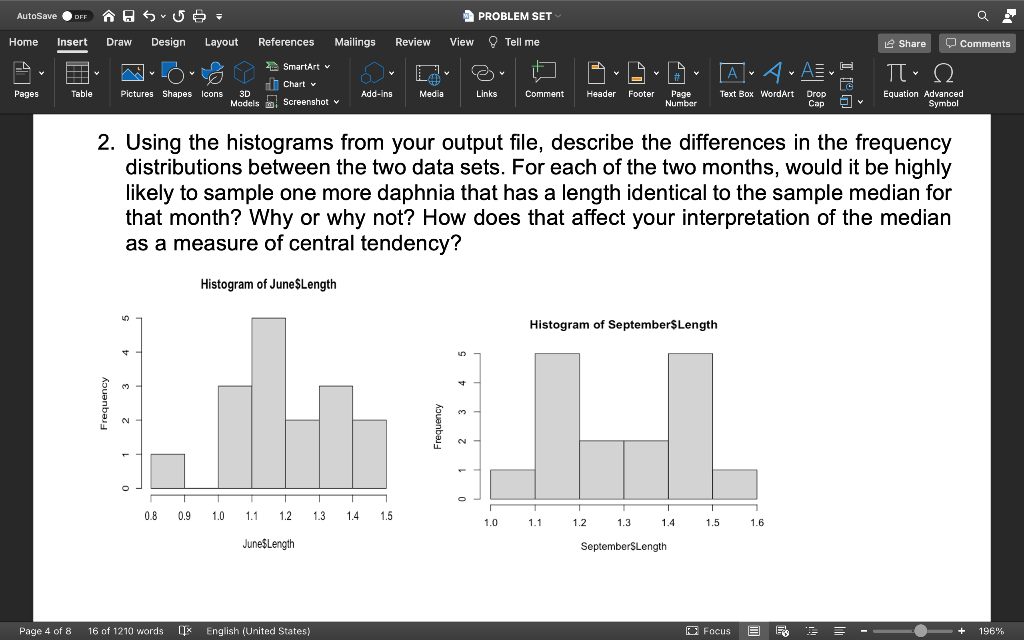
1- Using the histograms from your output file, describe the differences in the frequency distributions between the two data sets. For each of the two months, would it be highly likely to sample one more daphnia that has a length identical to the sample median for that month? Why or why not? How does that affect your interpretation of the median as a measure of central tendency?
2- What is the most probable biological reason for the change in mean daphnia length from June to September?
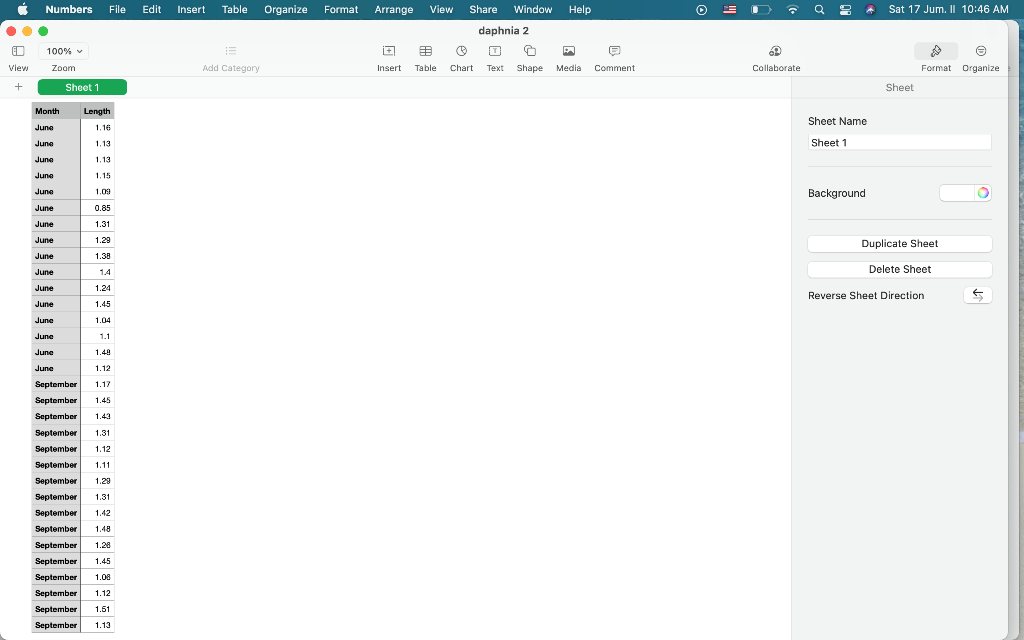
This is the numbers:
| Month | Length |
| June | 1.16 |
| June | 1.13 |
| June | 1.13 |
| June | 1.15 |
| June | 1.09 |
| June | 0.85 |
| June | 1.31 |
| June | 1.29 |
| June | 1.38 |
| June | 1.4 |
| June | 1.24 |
| June | 1.45 |
| June | 1.04 |
| June | 1.1 |
| June | 1.48 |
| June | 1.12 |
| September | 1.17 |
| September | 1.45 |
| September | 1.43 |
| September | 1.31 |
| September | 1.12 |
| September | 1.11 |
| September | 1.29 |
| September | 1.31 |
| September | 1.42 |
| September | 1.48 |
| September | 1.26 |
| September | 1.45 |
| September | 1.06 |
| September | 1.12 |
| September | 1.51 |
| September | 1.13 |
|
|
|
AutoSave OFF PROBLEM SET Q Home Insert Draw Design Layout References Mailings Review View Tell me e Share O Comments # HH T-22 SmartArt Chartv 3D Models Screenshot Av AvA Pages Table Pictures Shapes Icons Add-ins Media Links Comment Header Footer Text Box WordArt Page Number Drop Cap Equation Advanced Symbol 2. Using the histograms from your output file, describe the differences in the frequency distributions between the two data sets. For each of the two months, would it be highly likely to sample one more daphnia that has a length identical to the sample median for that month? Why or why not? How does that affect your interpretation of the median as a measure of central tendency? Histogram of June$Length Histogram of September$Length + w T 0.8 0.9 1.0 1.1 1.2 1.3 1.4 1.5 1 1.4 1 1.5 1.0 1.1 1.2 1.3 1.6 June$Length SeptemberSLength Page 4 of 8 16 of 1210 words English (United States) Focus ES 196% Numbers File Edit Insert Table Organize Format Arrange View Share Window Help Sat 17 Jum. ll 10:46 AM .. daphnia 2 100% + View Zoom Add Category Insert Table Chart Text Shape Media Comment Collaborate Format Organize + Sheet1 Sheet Month Length Sheet Name June June 1.16 June 1.13 Sheet1 June 1.13 June 1.15 1.09 Background June June June 0.85 1.31 ** 1.29 120 1.38 1 SR June Duplicate Sheet June Delete Sheet June a June 1.4 1.24 Reverse Sheet Direction 1.45 145 1.04 June - June - June - June 1.1 1.49 10 June 1.12 1.17 1 17 1.45 145 1.43 14 1124 1.31 ! 4141 1.12 1.11 1.28 1.31 September September September September September September September September September September September September September September September September 1.42 1.48 1.28 1.45 1.08 1.12 1.51 1.13 AutoSave OFF PROBLEM SET Q Home Insert Draw Design Layout References Mailings Review View Tell me e Share O Comments # HH T-22 SmartArt Chartv 3D Models Screenshot Av AvA Pages Table Pictures Shapes Icons Add-ins Media Links Comment Header Footer Text Box WordArt Page Number Drop Cap Equation Advanced Symbol 2. Using the histograms from your output file, describe the differences in the frequency distributions between the two data sets. For each of the two months, would it be highly likely to sample one more daphnia that has a length identical to the sample median for that month? Why or why not? How does that affect your interpretation of the median as a measure of central tendency? Histogram of June$Length Histogram of September$Length + w T 0.8 0.9 1.0 1.1 1.2 1.3 1.4 1.5 1 1.4 1 1.5 1.0 1.1 1.2 1.3 1.6 June$Length SeptemberSLength Page 4 of 8 16 of 1210 words English (United States) Focus ES 196% Numbers File Edit Insert Table Organize Format Arrange View Share Window Help Sat 17 Jum. ll 10:46 AM .. daphnia 2 100% + View Zoom Add Category Insert Table Chart Text Shape Media Comment Collaborate Format Organize + Sheet1 Sheet Month Length Sheet Name June June 1.16 June 1.13 Sheet1 June 1.13 June 1.15 1.09 Background June June June 0.85 1.31 ** 1.29 120 1.38 1 SR June Duplicate Sheet June Delete Sheet June a June 1.4 1.24 Reverse Sheet Direction 1.45 145 1.04 June - June - June - June 1.1 1.49 10 June 1.12 1.17 1 17 1.45 145 1.43 14 1124 1.31 ! 4141 1.12 1.11 1.28 1.31 September September September September September September September September September September September September September September September September 1.42 1.48 1.28 1.45 1.08 1.12 1.51 1.13
Step by Step Solution
There are 3 Steps involved in it

Get step-by-step solutions from verified subject matter experts