

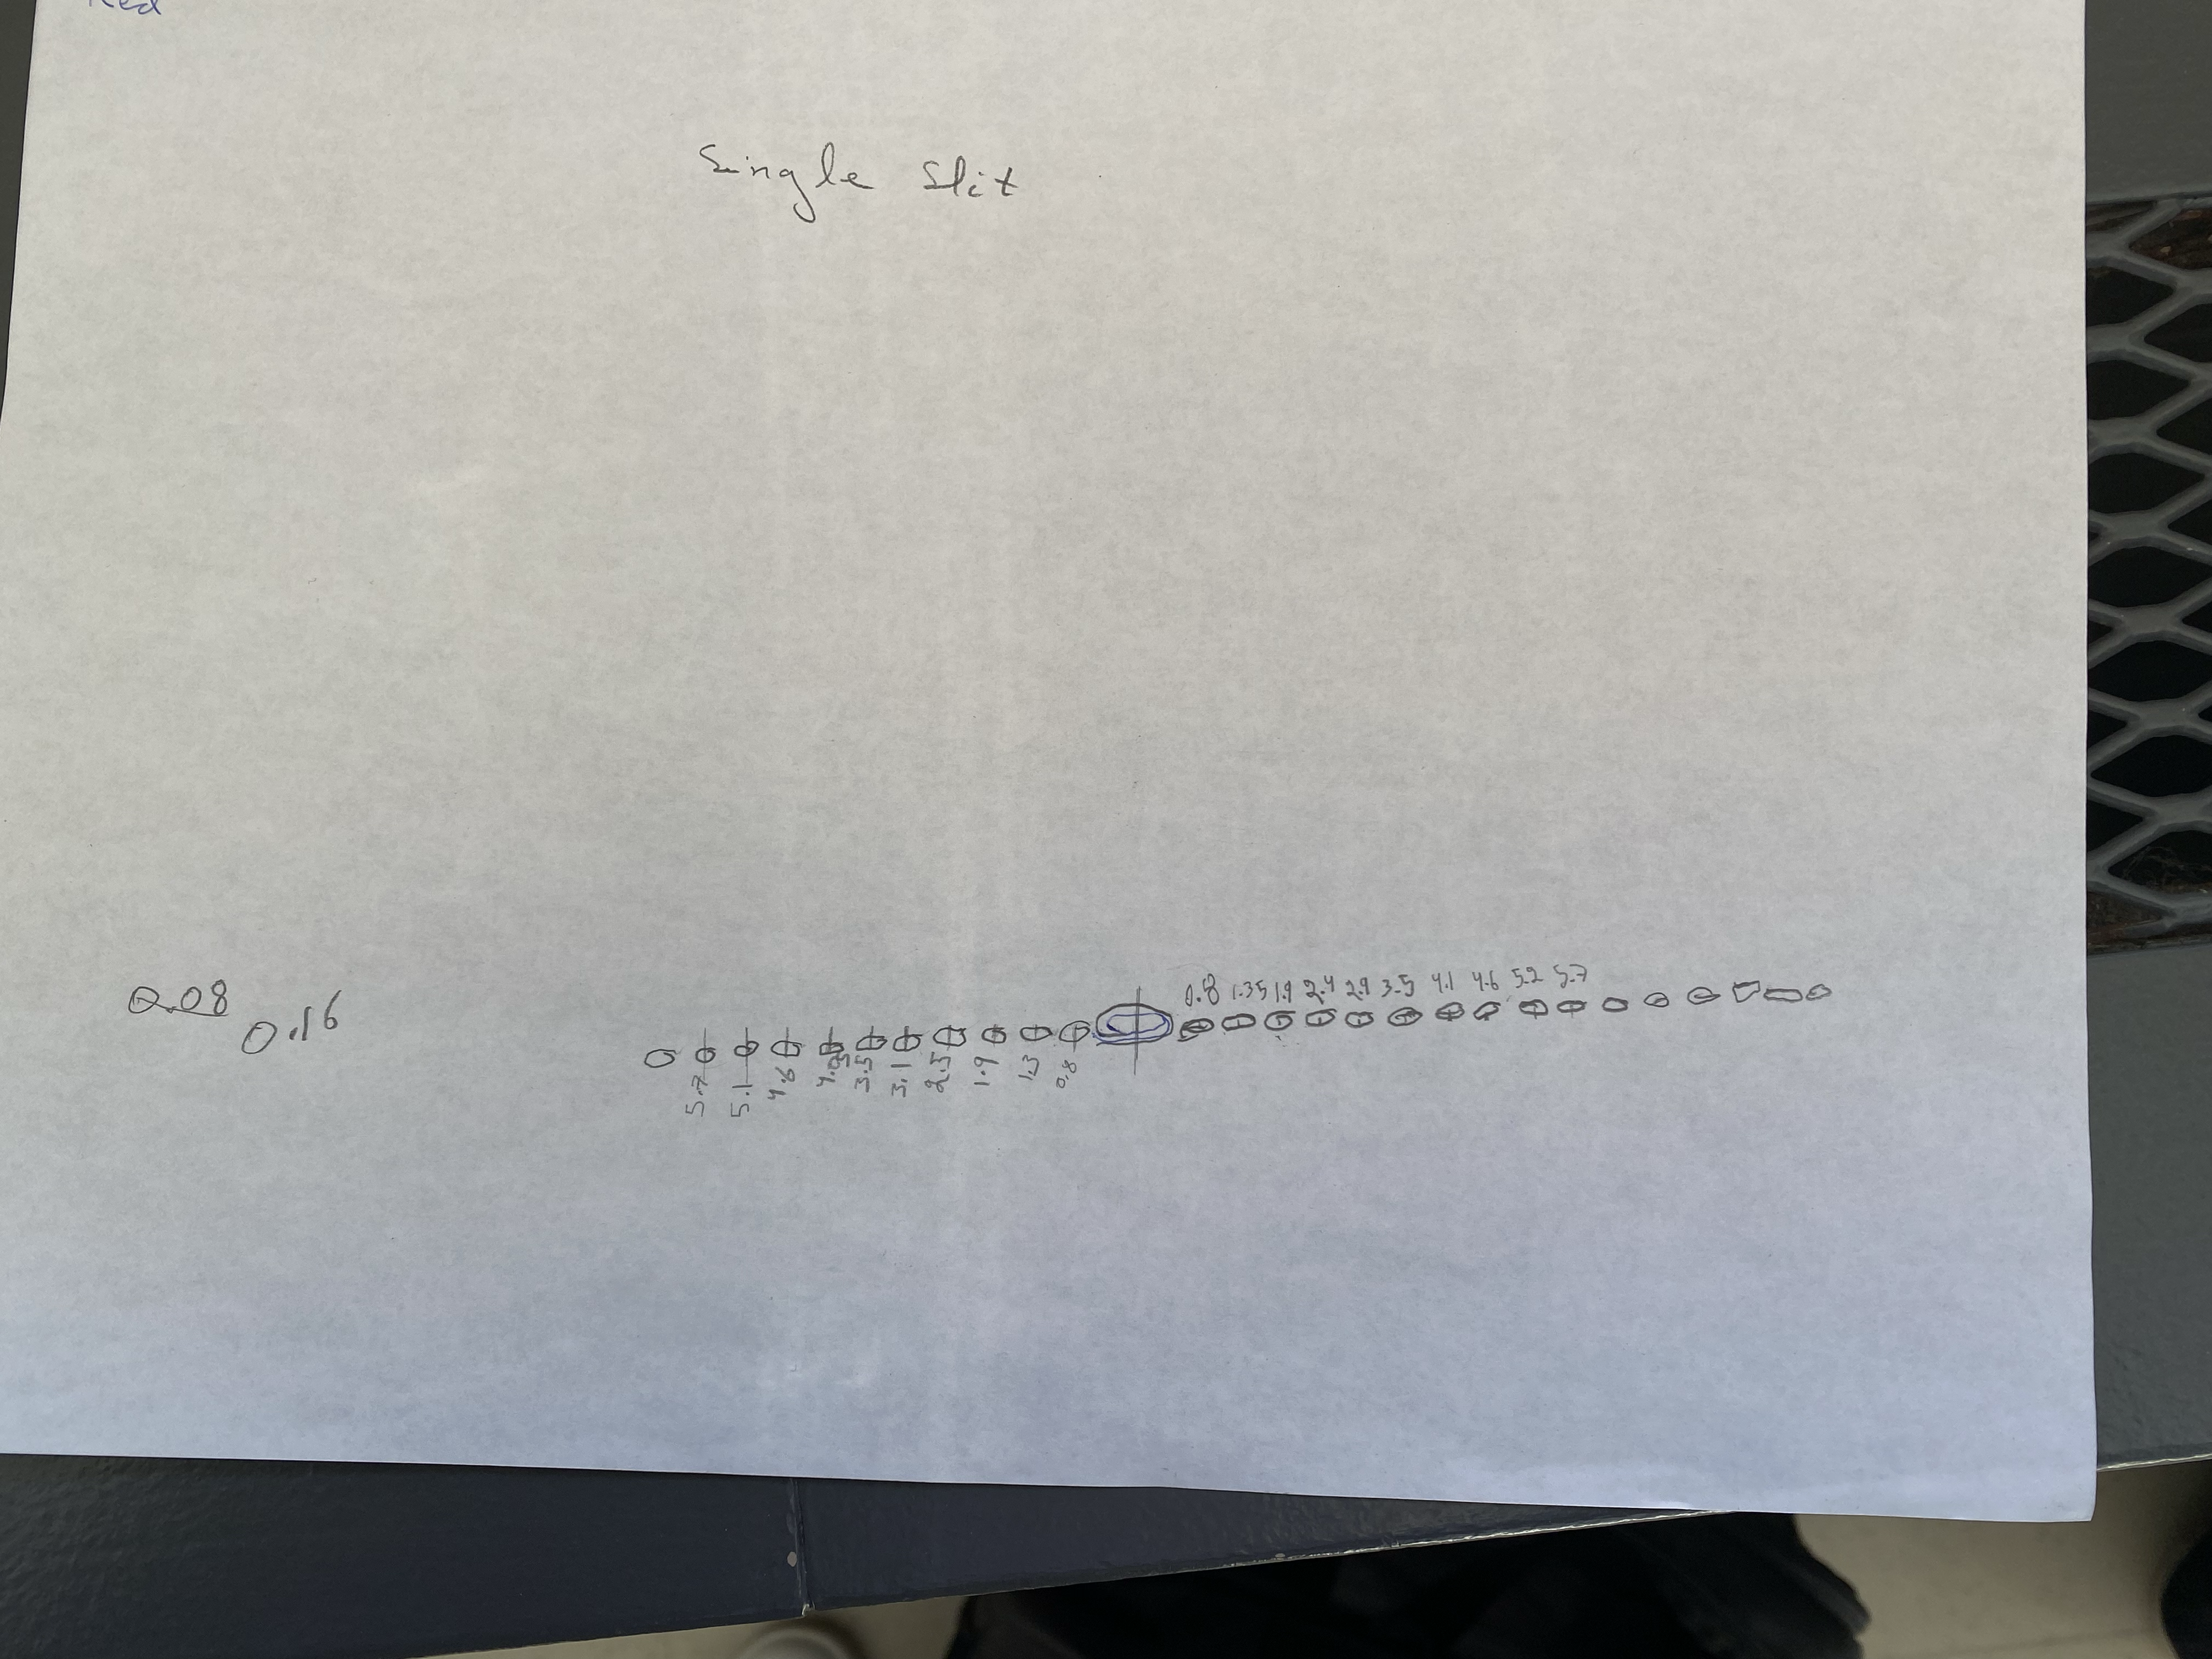
Question: 1. Using the single-slit data, measure y (See Fig.3) for each dark fringe and make a table of (m, y) values, note for dark fringes
1. Using the single-slit data, measure "y" (See Fig.3) for each dark fringe and make a table of (m, y) values, note for dark fringes to the left of the central bright tringe both y and m are negative. Use MS Excel to plot y vs m using a trend line fit a straight line through the points. Use the slope of the line and equation (2) to calculate the laser wavelength.
Equation (2): (y=m(?D/b)(m=1,2,...)
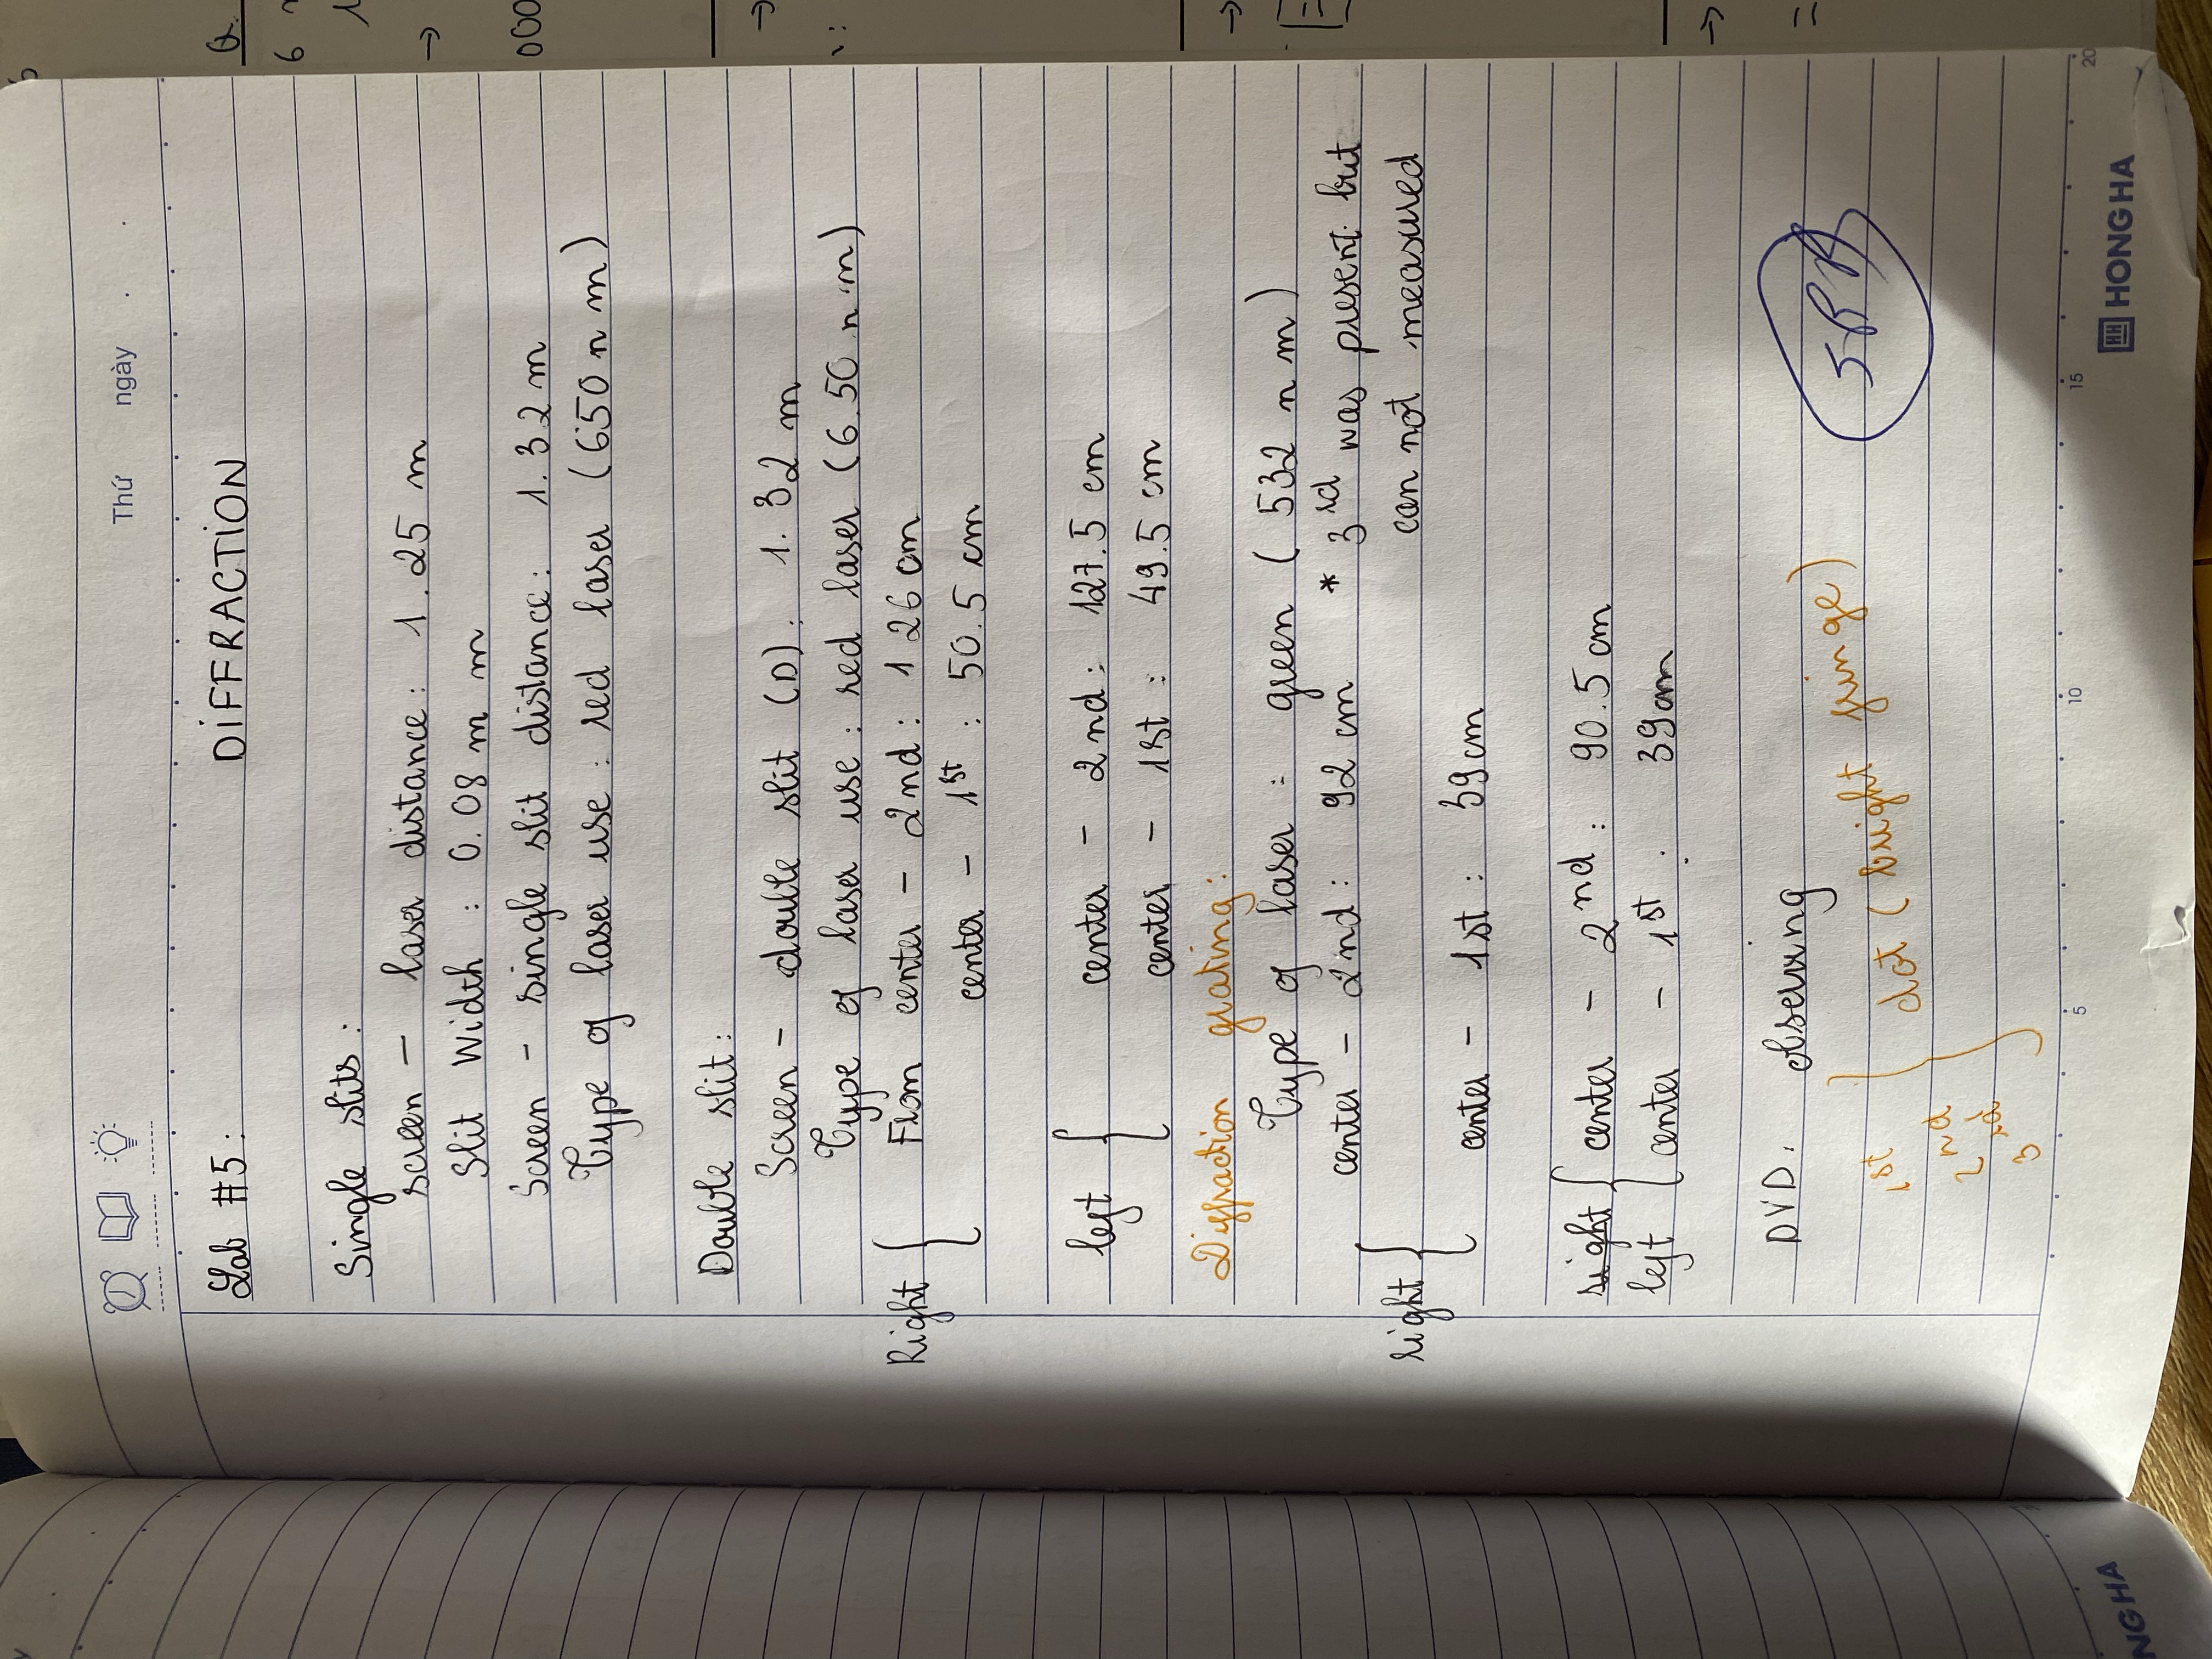
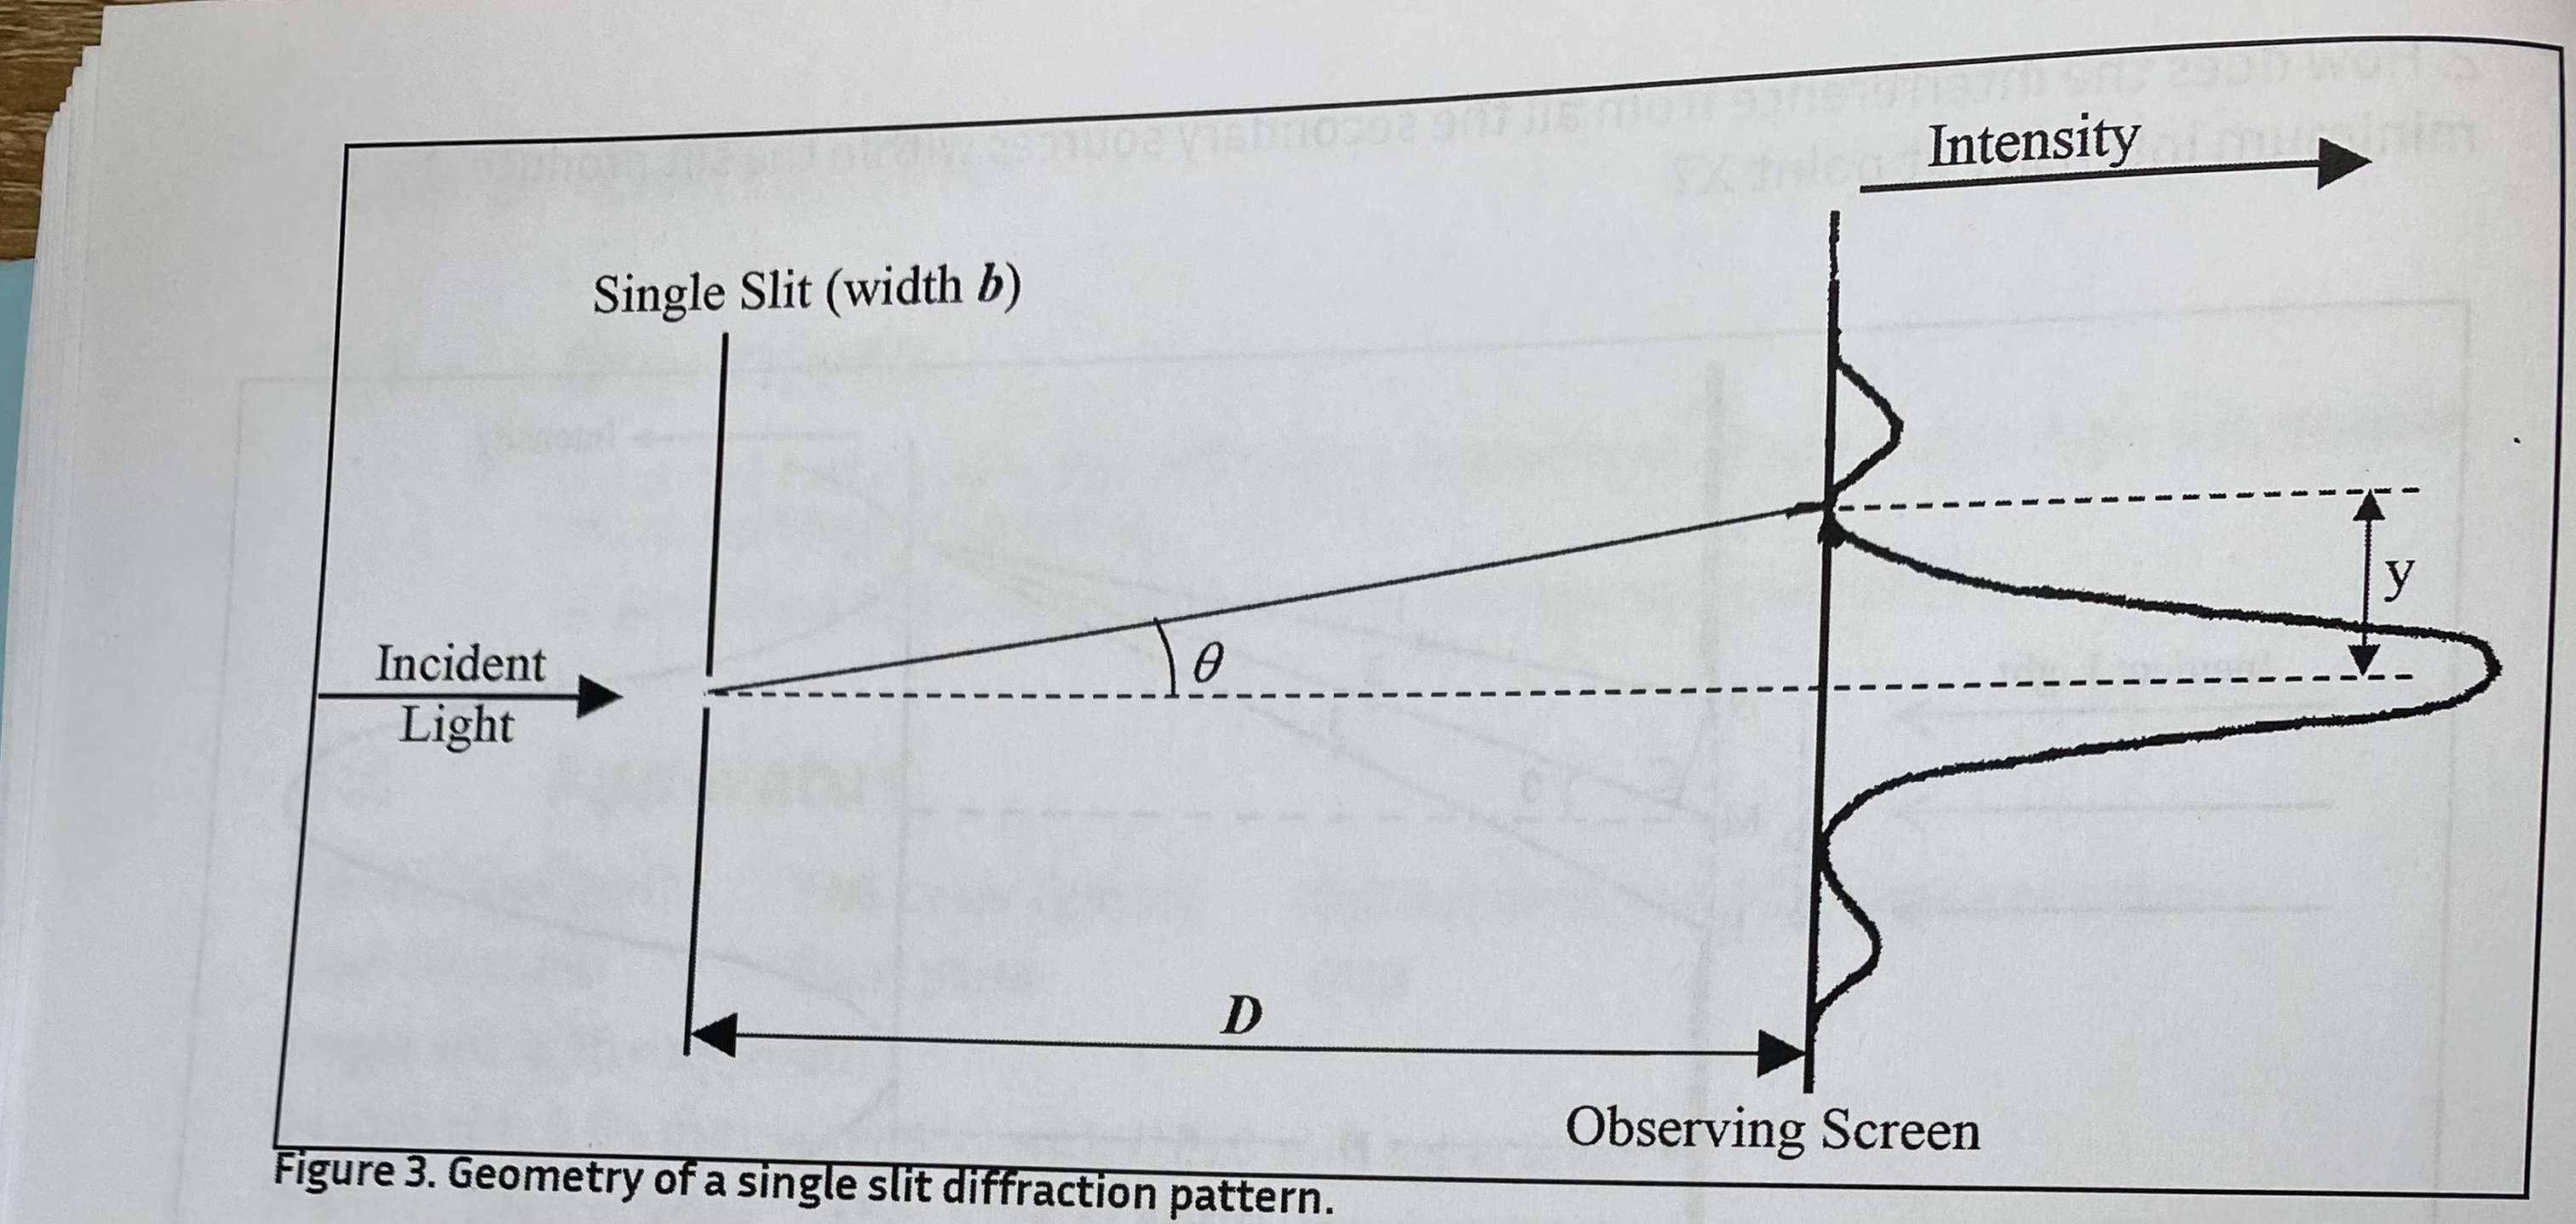
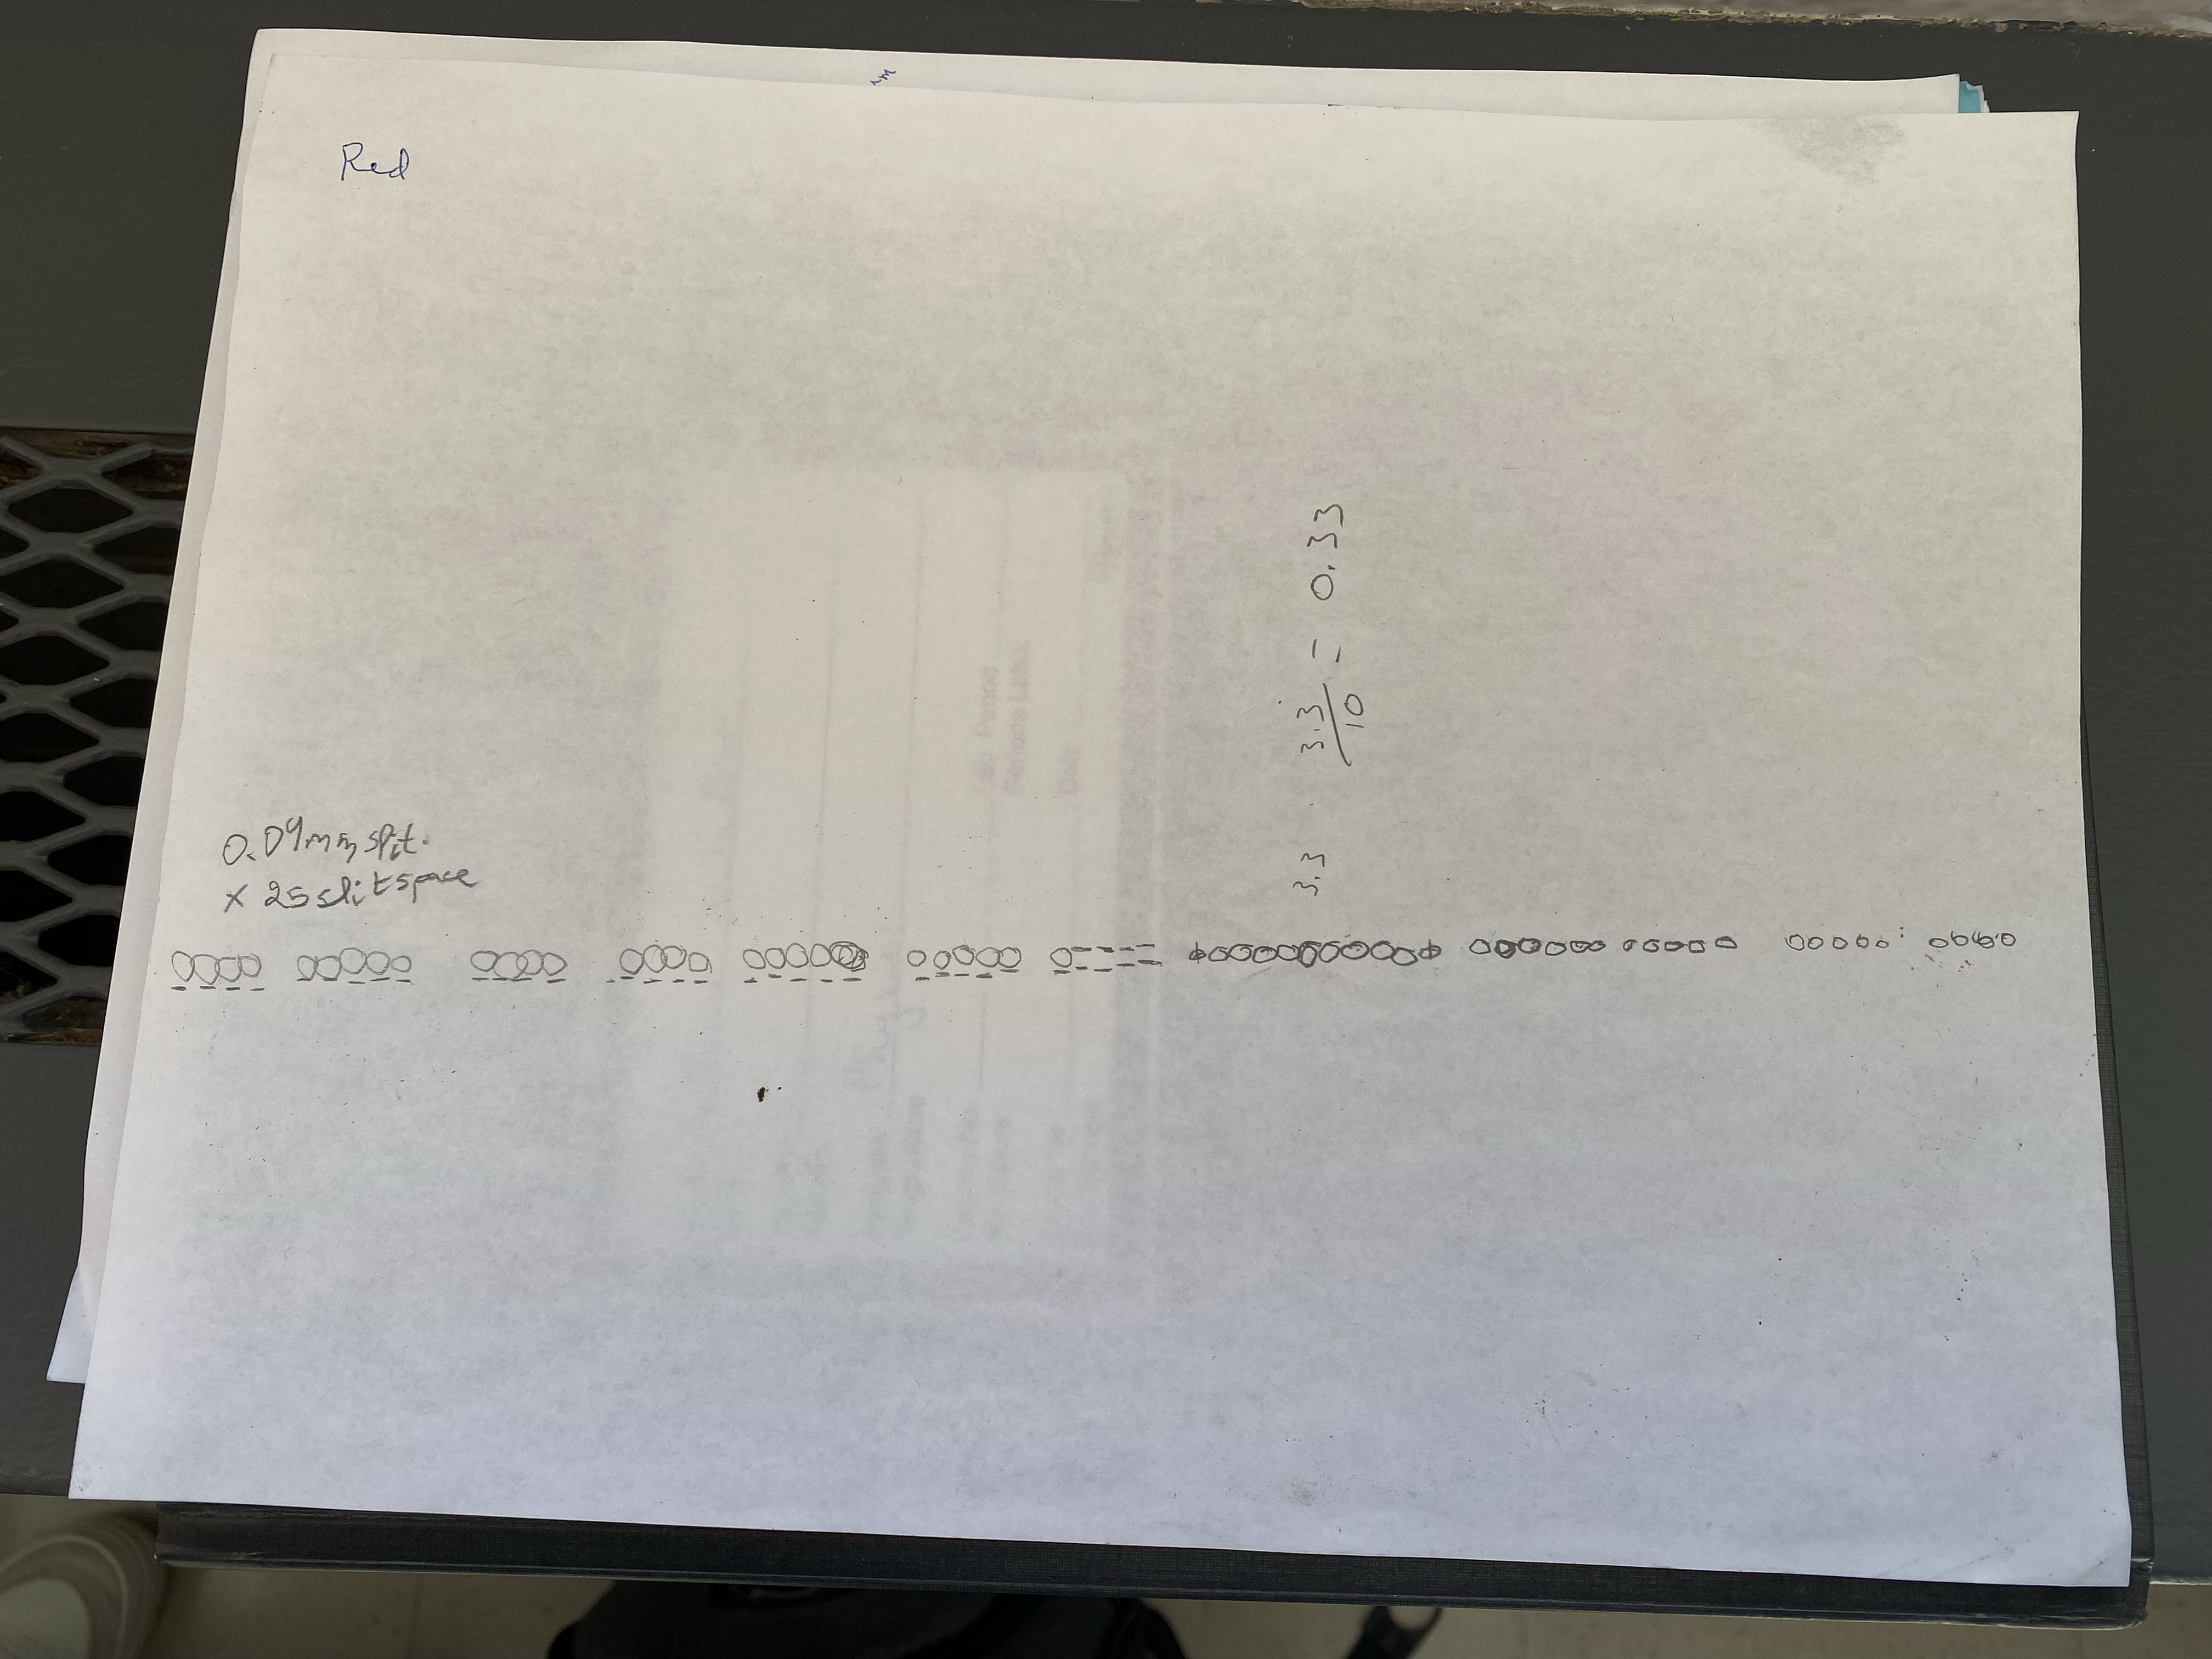
Thur ngay Lab #5 : DIFFRACTION single slits screen - lase distance: 1 25 m slit width : 0. 08 m m Screen - single slit distance: 1. 32 m OOC type of laser use red laser ( 650 n m ) Double slit. Screen - double slit ( D). 1. 32 m Type of laser use. red laser (6 50 nim ) Right From center - and : 1 26 om center - 187 50.5 am center - 2 nd: 127.5 em center - 18t : 49.5 cm Diffraction grating : T bype of laser : green ( 532 n m center - and: 92 cm * 2 nal was present. but light can not measured center - lot : 39 cm sight center - and 90.5 cm let center to 3gam DVD , ofsewing dot ( bright fun ge . 9 VG HA HH HONG HA\fIntensity Single Slit (width b) Incident Light D Observing Screen Figure 3. Geometry of a single slit diffraction pattern.
Step by Step Solution
There are 3 Steps involved in it

Get step-by-step solutions from verified subject matter experts