

Question: 1. Using the values of Log Lx values ) and Log T (y values) plot a scatter plot and use linear regression to find the
1. Using the values of Log Lx values ) and Log T (y values) plot a scatter plot and use linear regression to find the line of best fit. Show graphs.2. Find a and k, a is the slope of the graph, and k is the y intercept which is equal to log k. If you do 10^ y intercept value, you get k.Show equations for both a and k and percent error for both as well.
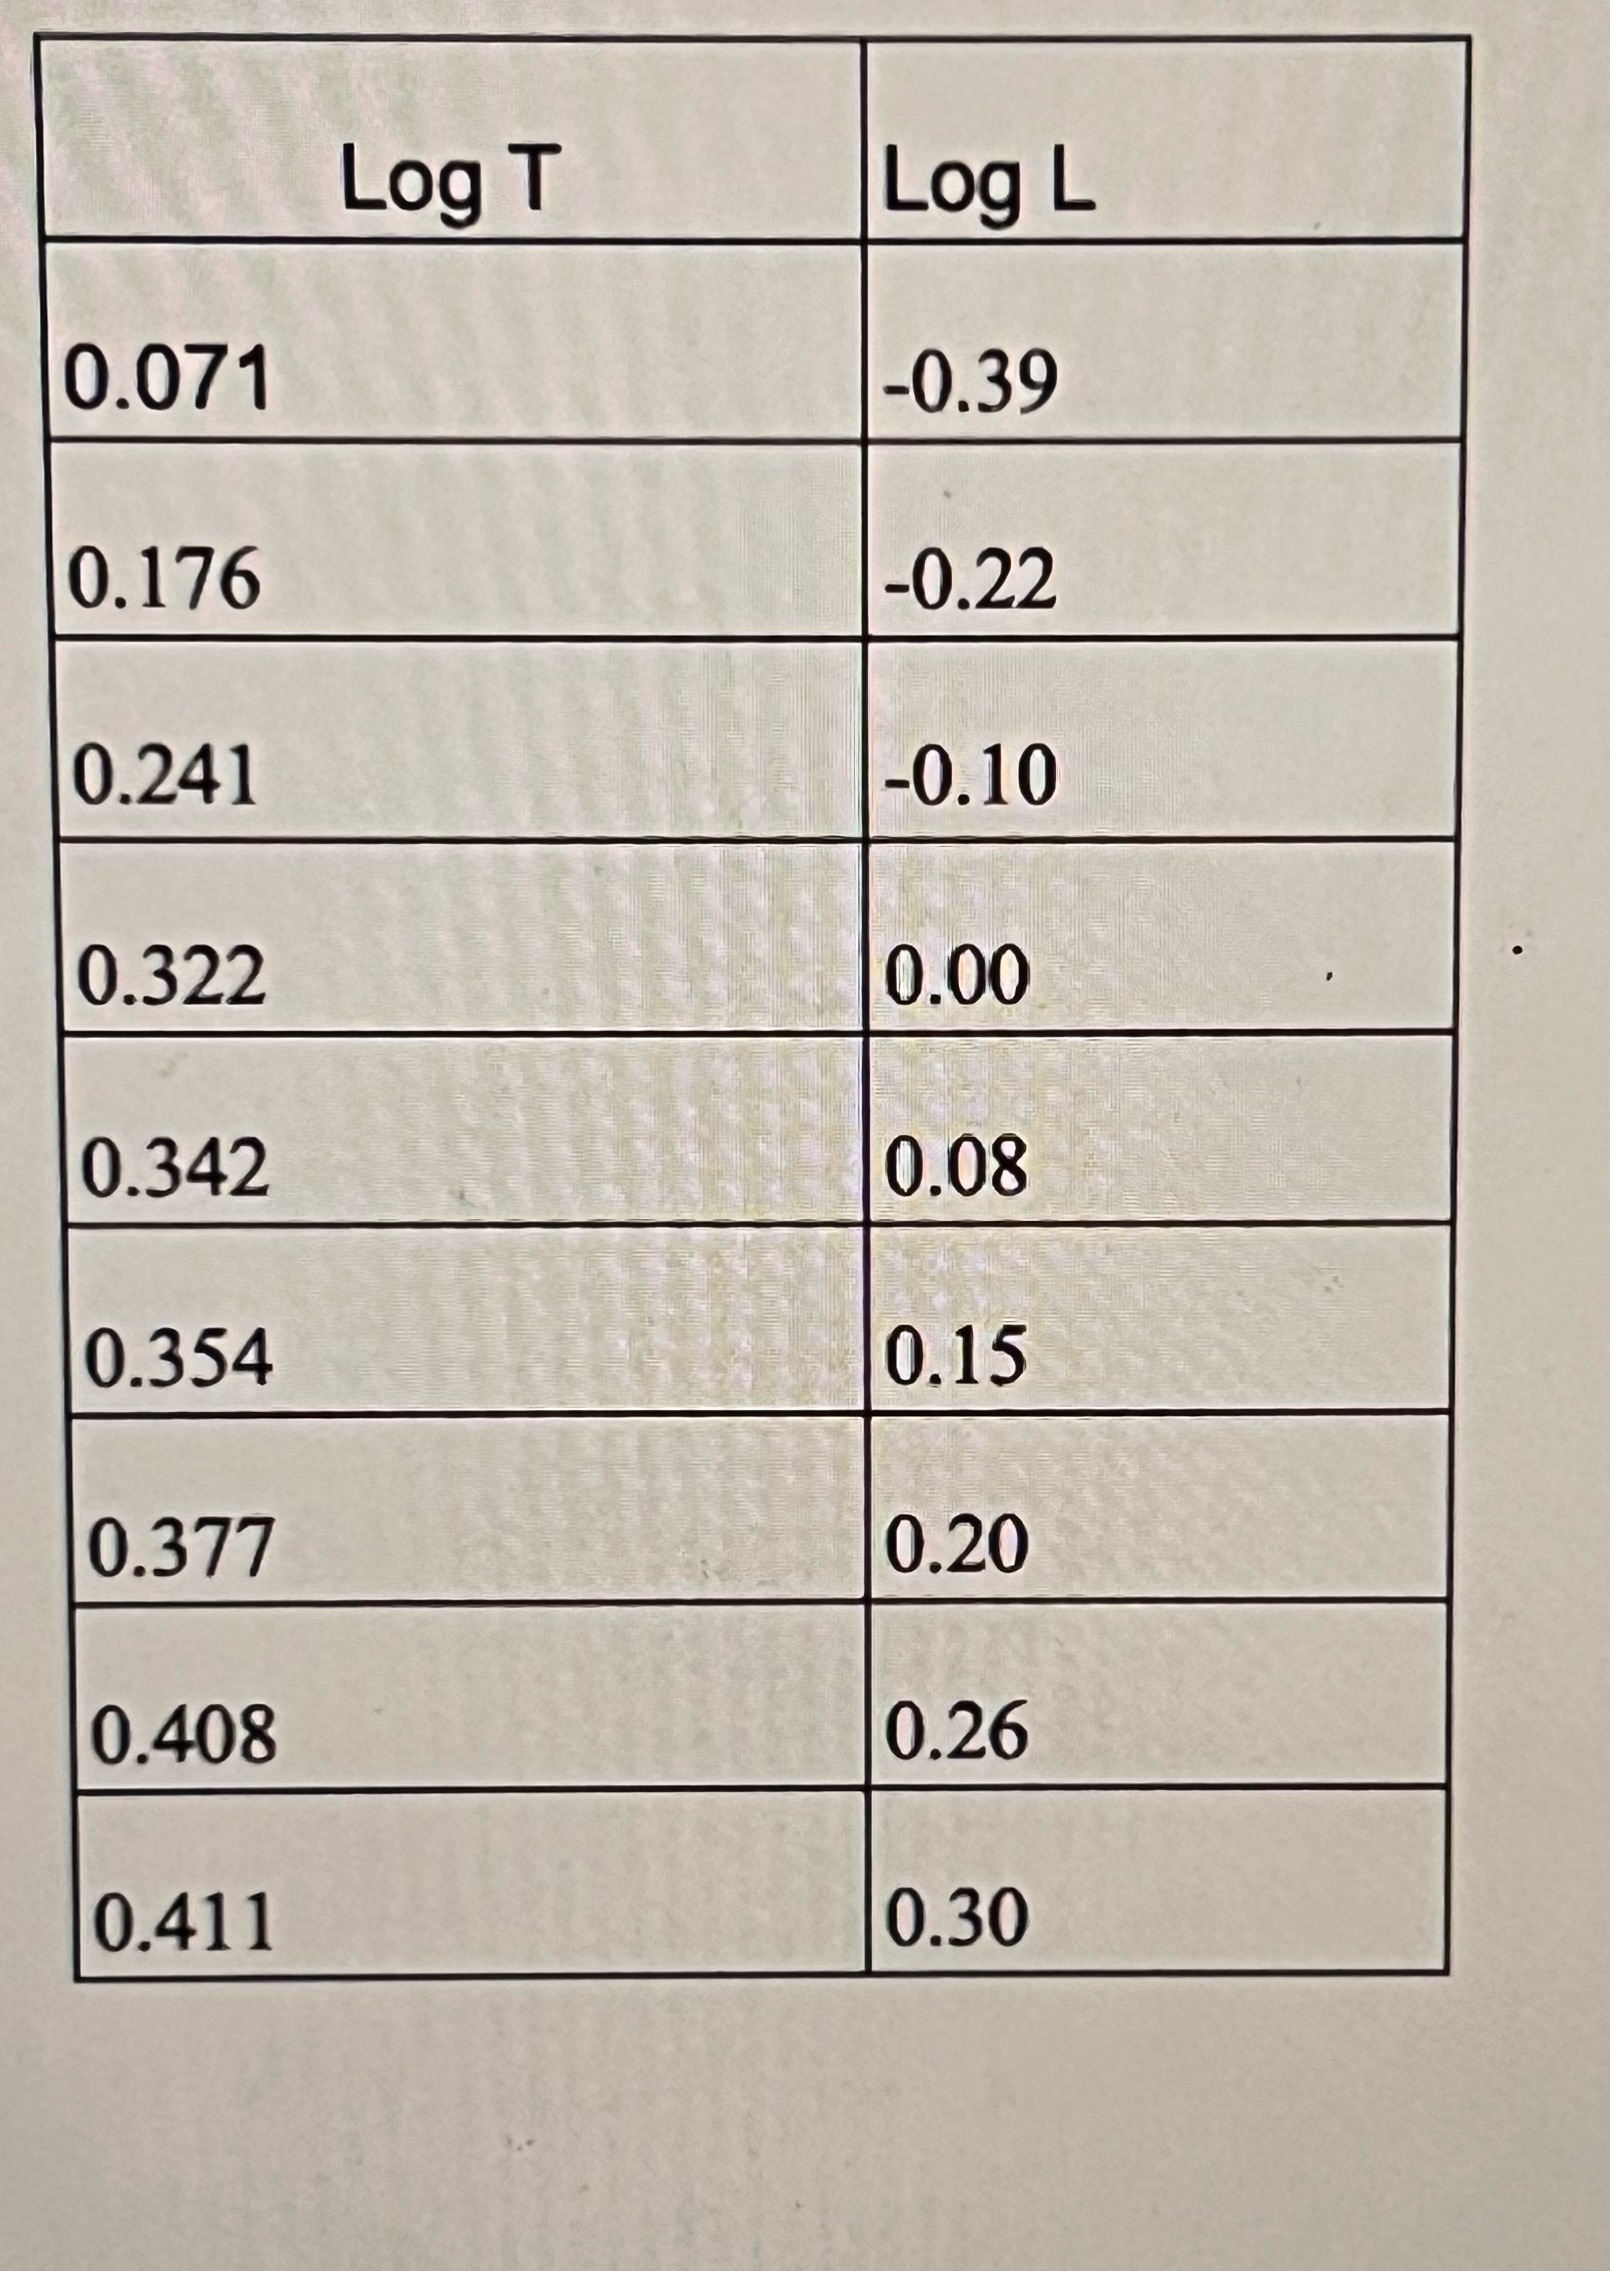
Log T Log L 0.071 -0.39 0.176 -0.22 0.241 -0.10 0.322 0.00 0.342 0.08 0.354 0.15 0.377 0.20 0.408 0.26 0.411 0.30
Step by Step Solution
There are 3 Steps involved in it
1 Expert Approved Answer
Step: 1 Unlock

Question Has Been Solved by an Expert!
Get step-by-step solutions from verified subject matter experts
Step: 2 Unlock
Step: 3 Unlock