

Question: 1: what does an X variable (or Independent variable) in the table above measure? What does the Y variable in the table measure? 2: look
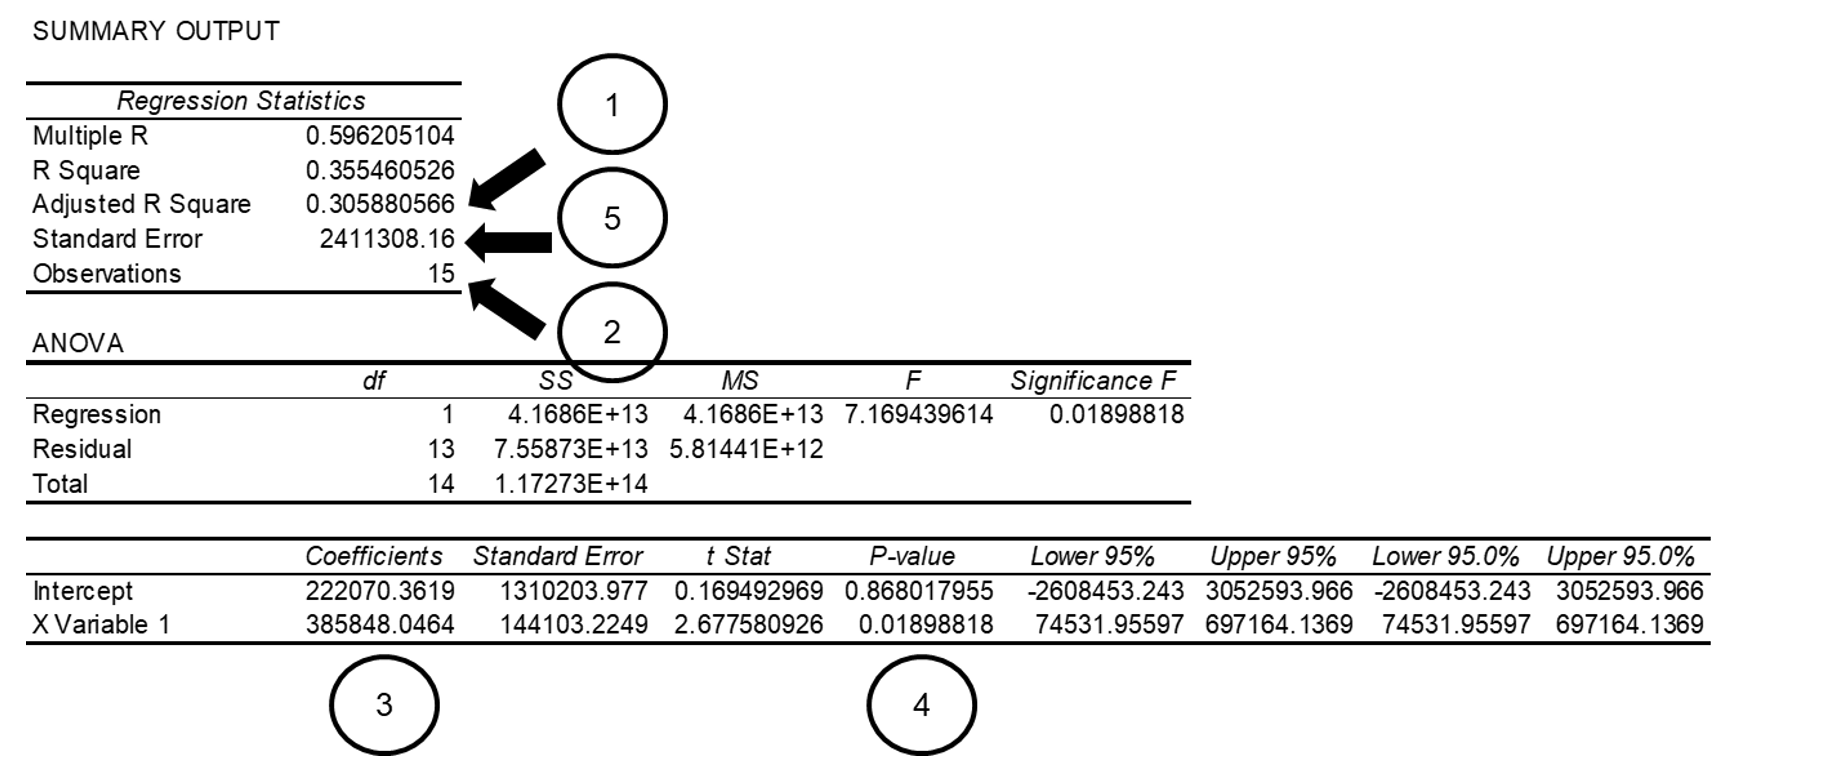
1: what does an X variable (or Independent variable) in the table above measure? What does the Y variable in the table measure?
2: look at number 3. Interpret 385848 (Do not simply say it is a slope, and use the number in your answer, and its unit is thousand). Be sure to take what x variable and y variable indicate into consideration.
3: look at number 4. What does 0.01898818 mean in the table? What can you do with the p-value?
4: write an equation of the relationship between X variable and Y variable. Be sure to replace X variable and Y variable with real names of variables in your equation.
5: look at number 5. Using the 2 standard errors (95% confidence level), estimate the interval of predicted Free Cash Flow at the 16th year and interpret the result.
6: How can you reduce predictive errors of your predictive model except for increasing sample size? Suggest a way and discuss why. Do not suggest increasing data size or sample size.
SUMMARY OUTPUT Regression Statistics Multiple R 0.596205104 R Square 0.355460526 Adjusted R Square 0.305880566 Standard Error 2411308.16 Observations 15 5 ANOVA 2 df Significance F 0.01898818 Regression Residual Total 1 13 14 SS MS F 4.1686E+13 4.1686E+13 7.169439614 7.55873E+13 5.81441E+12 1.17273E+14 Intercept X Variable 1 Coefficients 222070.3619 385848.0464 Standard Error t Stat P-value 1310203.977 0.169492969 0.868017955 144103.2249 2.677580926 0.01898818 Lower 95% Upper 95% Lower 95.0% Upper 95.0% -2608453.243 3052593.966 -2608453.243 3052593.966 74531.95597 697164.1369 74531.95597 697164.1369 3 4 SUMMARY OUTPUT Regression Statistics Multiple R 0.596205104 R Square 0.355460526 Adjusted R Square 0.305880566 Standard Error 2411308.16 Observations 15 5 ANOVA 2 df Significance F 0.01898818 Regression Residual Total 1 13 14 SS MS F 4.1686E+13 4.1686E+13 7.169439614 7.55873E+13 5.81441E+12 1.17273E+14 Intercept X Variable 1 Coefficients 222070.3619 385848.0464 Standard Error t Stat P-value 1310203.977 0.169492969 0.868017955 144103.2249 2.677580926 0.01898818 Lower 95% Upper 95% Lower 95.0% Upper 95.0% -2608453.243 3052593.966 -2608453.243 3052593.966 74531.95597 697164.1369 74531.95597 697164.1369 3 4
Step by Step Solution
There are 3 Steps involved in it

Get step-by-step solutions from verified subject matter experts