

Question: 5. what does an X variable (or Independent variable) in the table above measure? What does the Y variable in the table measure? Be specific.
5. what does an X variable (or Independent variable) in the table above measure? What does the Y variable in the table measure? Be specific. Do not simply say free cash flow.
6.take a look at number 3. Interpret 356555 (Do not simply say it is a slope, and use the number in your answer, and its unit is thousand). Be sure to take what x variable and y variable indicate into consideration.
7.take a look at number 4. What does 0.03 mean in the table? What can you do with the p-value?
8. write an equation of the relationship between X variable and Y variable. Be sure to replace X variable and Y variable with real names of variables in your equation.
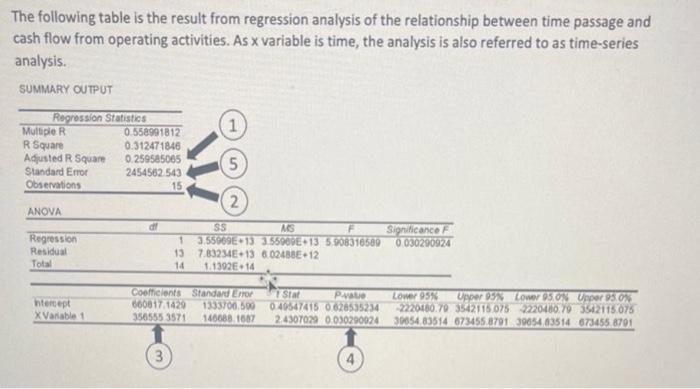
The following table is the result from regression analysis of the relationship between time passage and cash flow from operating activities. As x variable is time, the analysis is also referred to as time-series analysis
Step by Step Solution
There are 3 Steps involved in it

Get step-by-step solutions from verified subject matter experts