

Question: 1. what is the upper control limit for the individuals (X) chart? (include 2 decimal places) 2. what is the lower control limit for the
1. what is the upper control limit for the individuals (X) chart? (include 2 decimal places) 2. what is the lower control limit for the individuals (X) chart? (include 2 decimal places) 3. what is the upper control limit for the moving average chart? (include 2 decimal places) 4. what is the lower control limit for the moving average chart? (include 2 decimal places)
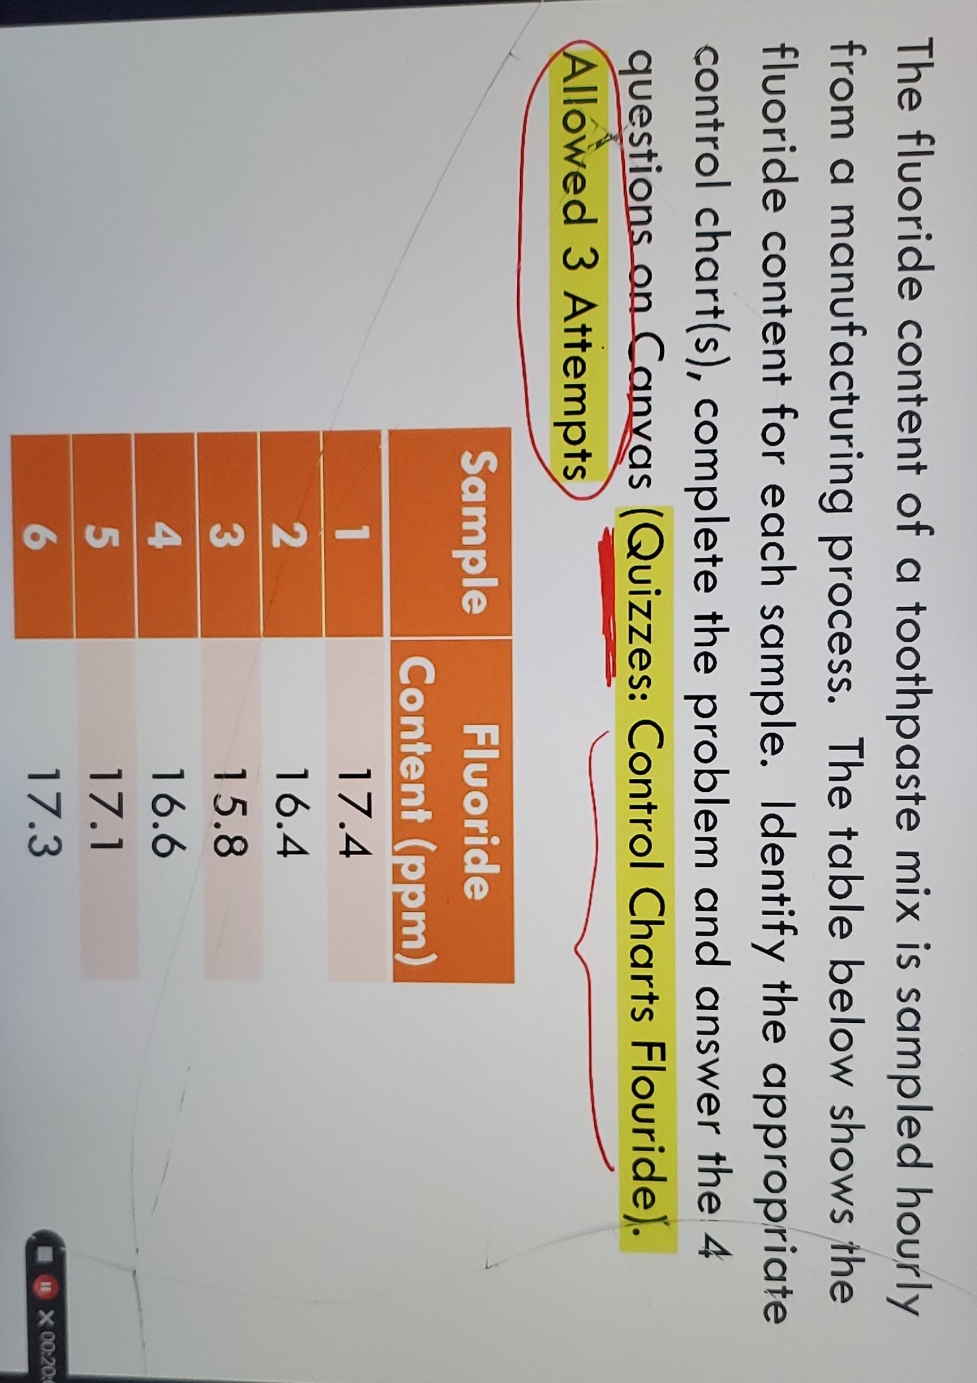
The fluoride content of a toothpaste mix is sampled hourly from a manufacturing process. The table below shows the fluoride content for each sample. Identify the appropriate control chart(s), complete the problem and answer the 4 questions on Canvas (Quizzes: Control Charts Flouride). Allowed 3 Attempts Sample Fluoride Content (ppm) 17.4 16.4 15.8 16.6 17.1 17.3 X 00:20
Step by Step Solution
There are 3 Steps involved in it

Get step-by-step solutions from verified subject matter experts