

Question: 1. Why might we not be able to build a regression model to predict a dependent variable? a. We might not know the independent
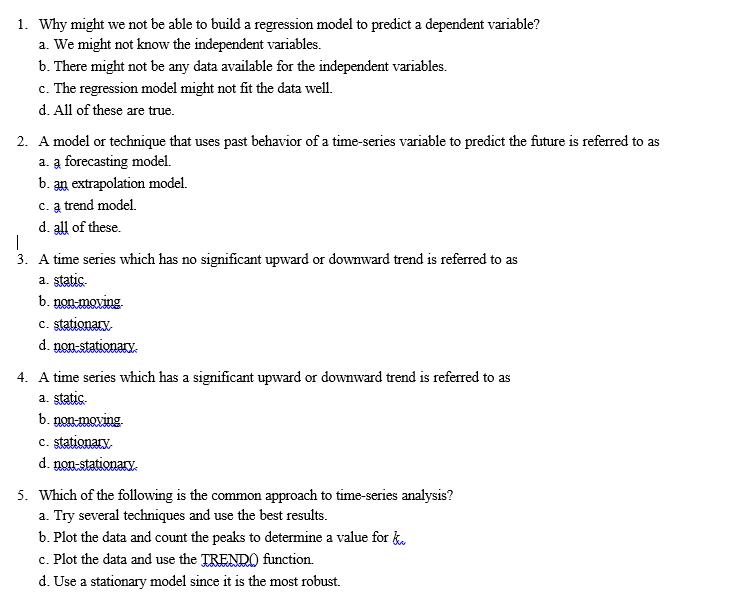
1. Why might we not be able to build a regression model to predict a dependent variable? a. We might not know the independent variables. b. There might not be any data available for the independent variables. c. The regression model might not fit the data well. d. All of these are true. 2. A model or technique that uses past behavior of a time-series variable to predict the future is referred to as a. a forecasting model. b. an extrapolation model. c. a trend model. d. all of these. 3. A time series which has no significant upward or downward trend is referred to as a. static. b. non-moving. c. stationary. d. non-stationary. 4. A time series which has a significant upward or downward trend is referred to as a. static. b. non moving c. stationary, d. non-stationary. 5. Which of the following is the common approach to time-series analysis? a. Try several techniques and use the best results. b. Plot the data and count the peaks to determine a value for k. c. Plot the data and use the TRENDO0 function. d. Use a stationary model since it is the most robust.
Step by Step Solution
3.44 Rating (157 Votes )
There are 3 Steps involved in it
Answer 1dAll of these are true Explanation Regression model is a relationship between a independen... View full answer

Get step-by-step solutions from verified subject matter experts