

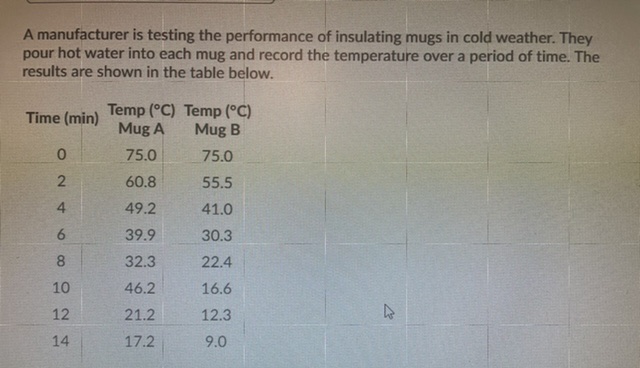
Question: 1) without creating a graph, how can you determine if the data is linear? 2)use technology to perform an exponential regression for each mug 3)
1) without creating a graph, how can you determine if the data is linear?
2)use technology to perform an exponential regression for each mug
3) using the mathematical model for part b) predict the temperature of the water for each mug after 20 minutes
4) the researchers test a third mug, and determine the following regression for its cooling data y= 75(0.93)x How well does the third mug insulate compared to mugs A and B?
Step by Step Solution
There are 3 Steps involved in it
1 Expert Approved Answer
Step: 1 Unlock

Question Has Been Solved by an Expert!
Get step-by-step solutions from verified subject matter experts
Step: 2 Unlock
Step: 3 Unlock