

Question: 1. You are a quality control analyst and have collected 20 samples, each with a sample size of 4 . The data is shown below:
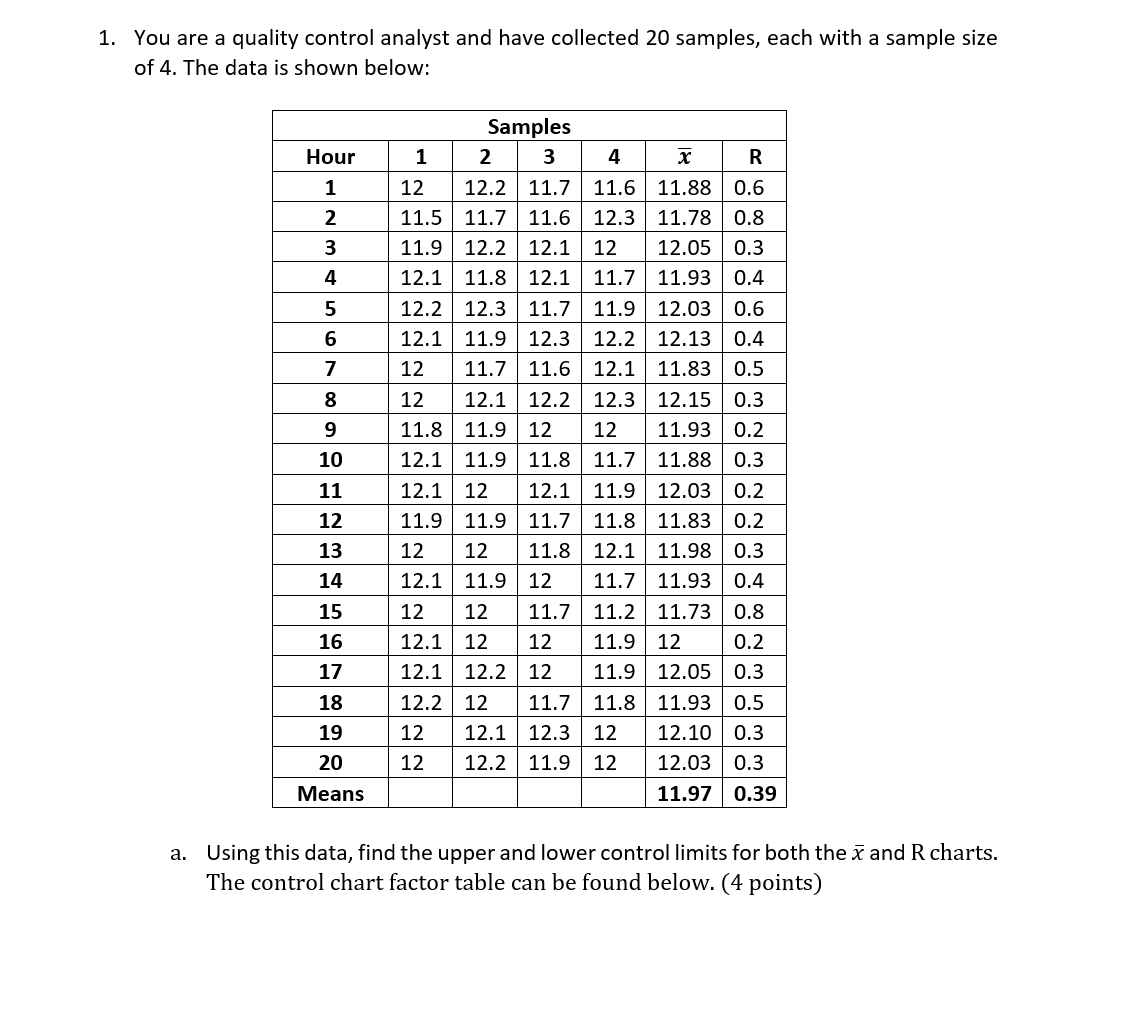
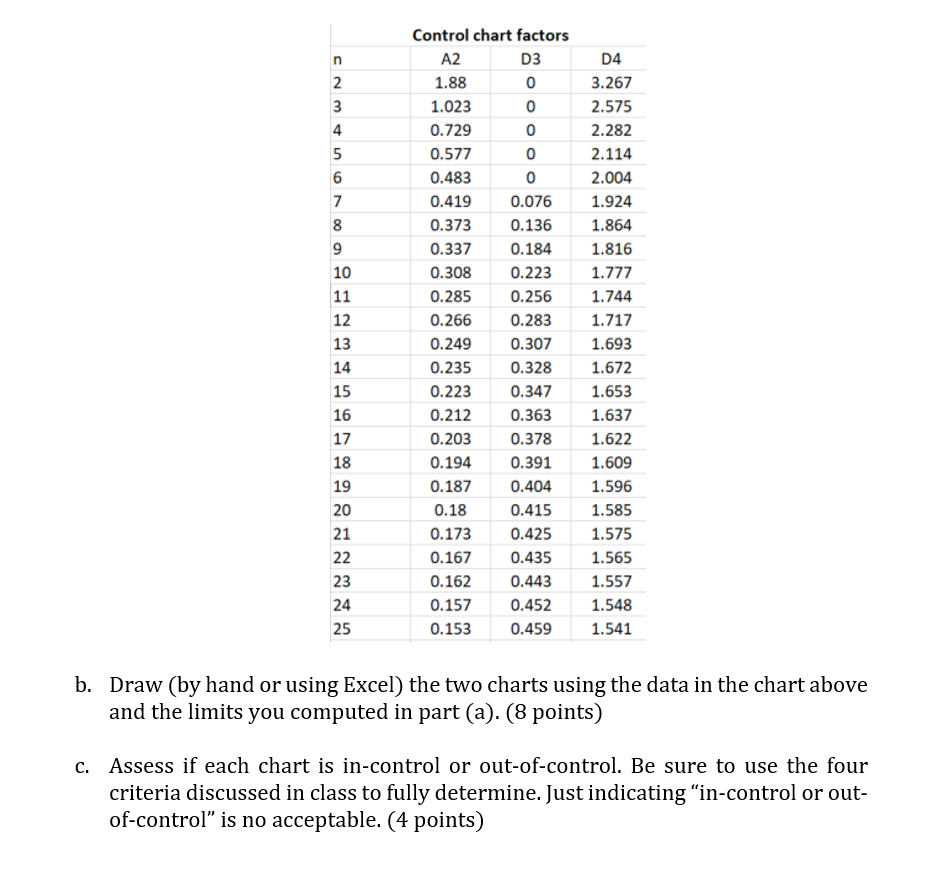
1. You are a quality control analyst and have collected 20 samples, each with a sample size of 4 . The data is shown below: a. Using this data, find the upper and lower control limits for both the x and R charts. The control chart factor table can be found below. (4 points) b. Draw (by hand or using Excel) the two charts using the data in the chart above and the limits you computed in part (a). (8 points) c. Assess if each chart is in-control or out-of-control. Be sure to use the four criteria discussed in class to fully determine. Just indicating "in-control or outof-control" is no acceptable. (4 points)
Step by Step Solution
There are 3 Steps involved in it
1 Expert Approved Answer
Step: 1 Unlock

Question Has Been Solved by an Expert!
Get step-by-step solutions from verified subject matter experts
Step: 2 Unlock
Step: 3 Unlock