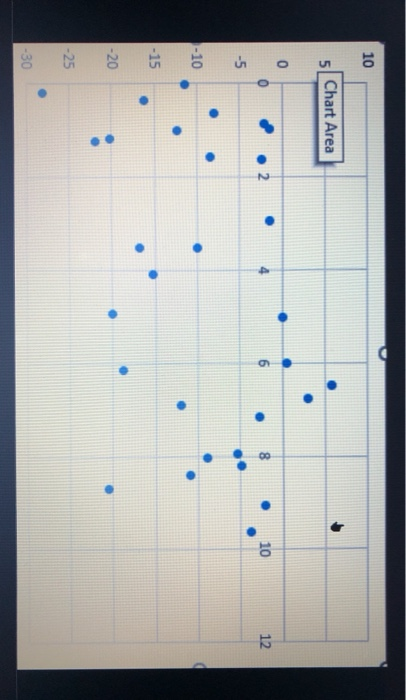
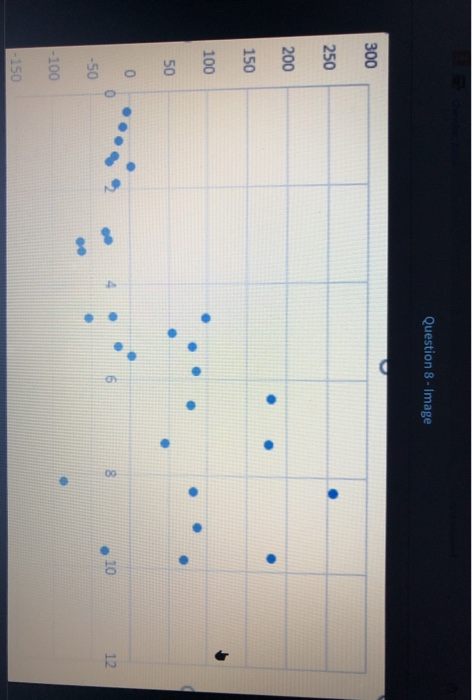
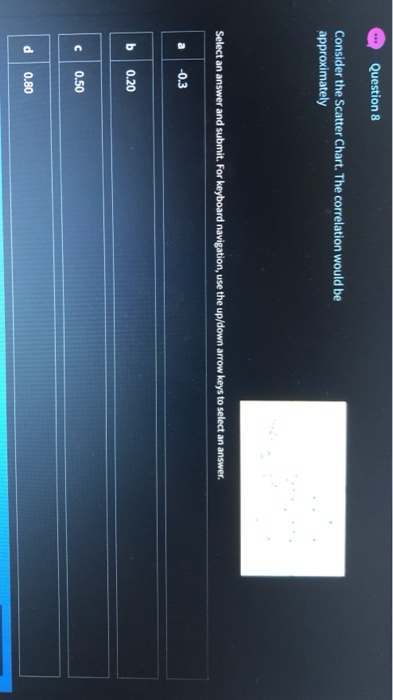
Question: 10 5 5 Chart Area 0 0 ? .2 10 12 -5 -10 -15 -20 -25 -30 Question 6 Consider the Scatter Chart. The correlation

10 5 5 Chart Area 0 0 ? .2 10 12 -5 -10 -15 -20
10 5 5 Chart Area 0 0 ? .2 10 12 -5 -10 -15 -20 -25 -30 Question 6 Consider the Scatter Chart. The correlation is approximately Select an answer and submit. For keyboard navigation, use the up/down arrow keys to select an answer. -0.30 b 0.0 0.30 0.60 Question 7 - Image 500 0 2 an 10 12 -500 1000 1500 2000 2500 3000 3500 Question 7 Consider the Scatter Chart. The correlation is approximately Select an answer and submit. For keyboard navigation, use the up/down arrow keys to select an answer. -0.75 b -0.25 0.0 d 0.50 Question 8 - Image 300 250 200 . 150 100 50 0 10 12 -50 -100 - 150 Question 8 Consider the Scatter Chart. The correlation would be approximately Select an answer and submit. For keyboard navigation, use the up/down arrow keys to select an answer. -0.3 b 0.20 0.50 d 0.80

Step by Step Solution

There are 3 Steps involved in it

1 Expert Approved Answer
Step: 1 Unlock blur-text-image
Question Has Been Solved by an Expert!

Get step-by-step solutions from verified subject matter experts

Step: 2 Unlock
Step: 3 Unlock

Students Have Also Explored These Related General Management Questions!