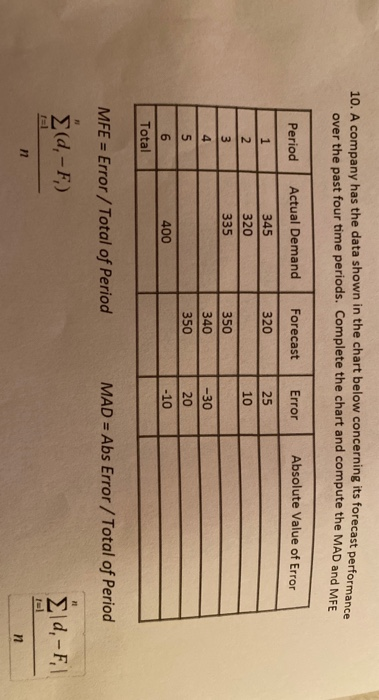
Question: 10. A company has the data shown in the chart below concerning its forecast performance over the past four time periods. Complete the chart and

10. A company has the data shown in the chart
10. A company has the data shown in the chart below concerning its forecast performance over the past four time periods. Complete the chart and compute the MAD and MFE Period Actual Demand Forecast Error Absolute Value of Error 1 345 320 25 2 320 10 3 335 350 4 -30 340 350 20 5 6 400 -10 Total MFE = Error/Total of Period MAD = Abs Error/Total of Period 21 (d,-F) Eld, - F, n n

Step by Step Solution

There are 3 Steps involved in it

1 Expert Approved Answer
Step: 1 Unlock blur-text-image
Question Has Been Solved by an Expert!

Get step-by-step solutions from verified subject matter experts

Step: 2 Unlock
Step: 3 Unlock

Students Have Also Explored These Related General Management Questions!