

Question: > 10. A services process is monitored using and R charts. Eight samples of n = 10 observations have been gathered with the following results:
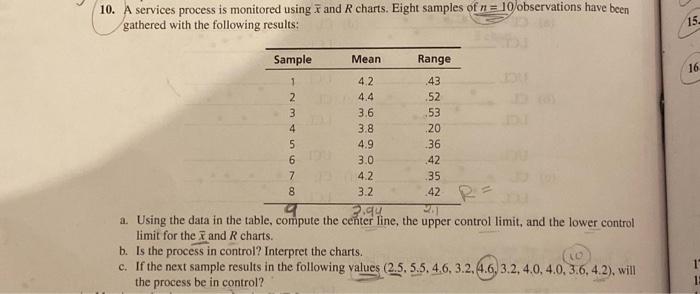
0. A services process is monitored using x and R charts. Eight samples of n=10 observations have been gathered with the following results: a. Using the data in the table, compute the center line, the upper control limit, and the lower control limit for the x and R charts. b. Is the process in control? Interpret the charts. c. If the next sample results in the following values (2.5. 5.5. 4.6, 3.2, 4.6. 3.2,4.0,4.0,3.6.4.2), will the process be in control? 0. A services process is monitored using x and R charts. Eight samples of n=10 observations have been gathered with the following results: a. Using the data in the table, compute the center line, the upper control limit, and the lower control limit for the x and R charts. b. Is the process in control? Interpret the charts. c. If the next sample results in the following values (2.5. 5.5. 4.6, 3.2, 4.6. 3.2,4.0,4.0,3.6.4.2), will the process be in control
Step by Step Solution
There are 3 Steps involved in it

Get step-by-step solutions from verified subject matter experts